9 Best Supermetrics Alternatives & Competitors in 2024


Supermetrics is an add-on that lets you pull data from 150+ sources into known platforms like Google Sheets, Excel, PowerBI, Looker, BigQuery, Azure Warehouse, etc.
The platform powers up the spreadsheet it's connected to and makes it ready to receive data from various sources.
One of the major reasons why people choose Supermetrics is that it has a zero-learning curve.
How? Supermetrics makes a tool that you are already familiar with, ready-to-accept data, and streamlines recurring reports. As a result, it doesn’t change anything from your current setup but acts as an ‘add-on.’
However, when you need a tool that does more than integrate data via connectors, has AI capabilities for data analysis and visualization, has a better UI, and is affordable, Supermetrics may fall short.
In this article, I will tell you why you should try an alternative to Supermetrics and discuss the best ones in the market.
Why Do You Need a Supermetrics Alternative?
There are three main reasons why you need to switch from Supermetics to an alternative:
Supermetrics has no built-in visualization capabilities
It’s slow to update existing connectors, which leads to missing features
Loads slowly when you connect a large dataset
Reason 1. Supermetrics Has No Built-In Visualization Capabilities
Supermetrics does not have built-in visualization capabilities, so it must rely on suboptimal Google Sheets, Excel, and other spreadsheet software layouts.
Most users, in search of an alternative to Google Sheets and Excel for data visualization, connect Supermetrics with Looker Studio and then try to figure out how that works.
But remember that if anything goes wrong when connecting Supermetrics to Looker, you’d have to troubleshoot it yourself because Looker Studio doesn’t have customer support.
Visualizing data with Supermetrics is a time-consuming and inaccurate process.
Reason 2. Supermetrics is Slow to Update Their Existing Connectors
Supermetrics doesn’t do a great job of updating its connectors to incorporate new features, functionalities, and changes from the integrated platforms.
The fact that the Facebook connector is still referred to as Facebook, despite the company rebranding to Meta in 2021, highlights the lag in updating these integrations.
This results in Supermetrics connectors missing out on significant features that could benefit its users.

Reason 3. Loads Slowly for Large Datasets
Many users complain about the decreased speed of Supermetrics when it's connected to a large dataset. There’s no doubt that Supermetrics is fast and efficient for collecting data, but it slows down when analyzing minute details or handling projects with millions of rows of data.

What are the Best Supermetrics Alternatives and Competitors?
Some of the best alternatives to Supermetrics are:
Rows – Spreadsheet software that makes it easy for you to transform and visualize data.
Coefficient – Data connector software that allows you to ingest live data from multiple data sources.
Metabase – Powerful analytics tool for data collection and exploration.
Zapier – No-code automation builder software.
Make – Create workflows for automatic data collection, extraction, and analysis.
Looker – Data visualization and reporting tool.
Funnel – Intuitive marketing data automation software.
Improvado – AI-powered marketing and analytics platform.
Power My Analytics – Lets you do data ingestion from marketing and e-commerce platforms.
1. Rows
Data is an important asset for any business. It backs your business-related decisions and brings clarity about what’s working and what’s not.
Rows is a spreadsheet software that makes it easy for you to transform and visualize data.
Here are the key features it offers that makes it a perfect Supermetrics alternative:
Feature 1. Data Integration
Like Supermetrics, Rows integrates with 50+ data sources and imports data from them with just a few clicks.
The best part? All data connectors in Rows are built-in native features, which means that you don’t have to rely on external add-ons to use AI in your analysis.
Curious about how Rows does it?
It handles JSONs in the grid and converts them into table format.
Some examples of data integration in Rows are:
Import Google Analytics 4 data to Rows and get key analytics and reporting. Pick one of the recommended reports or build your own custom view as follows:
Or you can:
Connect your LinkedIn page and track comments to your posts.
Connect Slack to Rows and set alert automation to your #social channel whenever a new comment appears on your social media posts. All from a spreadsheet.
Import a Notion database in Rows with a few clicks, enrich data, and send it back to Notion.
When the tool you’re working with isn’t listed in our catalog, use our HTTP tool to make GET, POST, PATCH, and PUT requests to any endpoint using basic or API token authentication methods.
See how it works in the interactive demo below:
You feel ready to try it yourself?
💡 Try to make a GET request yourself with our HTTP Request Tester: input the endpoint, the headers and params and visualize the content of the response in a cell.
Feature 2. Comes with Built-in AI to Answer Your Data-Related Questions
With Rows and AI integrations, it’s now easy to do data analysis, even if you’re a non-data-friendly person. You can ask questions to the AI in natural language and solve complex issues like doing sentiment analysis, cleaning up data, and more.
There’s no need to install a third-party plugin for the AI to work. Everything is in-built, leading to a seamless user experience.
When it comes to AI, Rows has three main components:
1. AI Functions
Rows integrates with Open AI for its 14 proprietary functions that automate prompts and address specific types of tasks.
Here’s one of the use cases of AI functions – EXTRACT_OPENAI in action:
Similarly, you can also execute sentiment analysis on a social media comment or product review using the function – SENTIMENT_ANALYSIS_OPENAI or clean up data using APPLY_TASK_OPENAI.
Discover more about all possible use cases of AI in Rows.
2. AI Analyst
Rows’ AI Analyst allows you to use natural language, ask data-related questions to AI, and get answers to complex calculations in seconds. It does all the calculations for you, including descriptive statistics, data summarization, transformation, and pivoting. Discover more.
3. AI Subtitles
Ask AI to generate subtitles for your tables and graphs that include key insights from the data displayed.
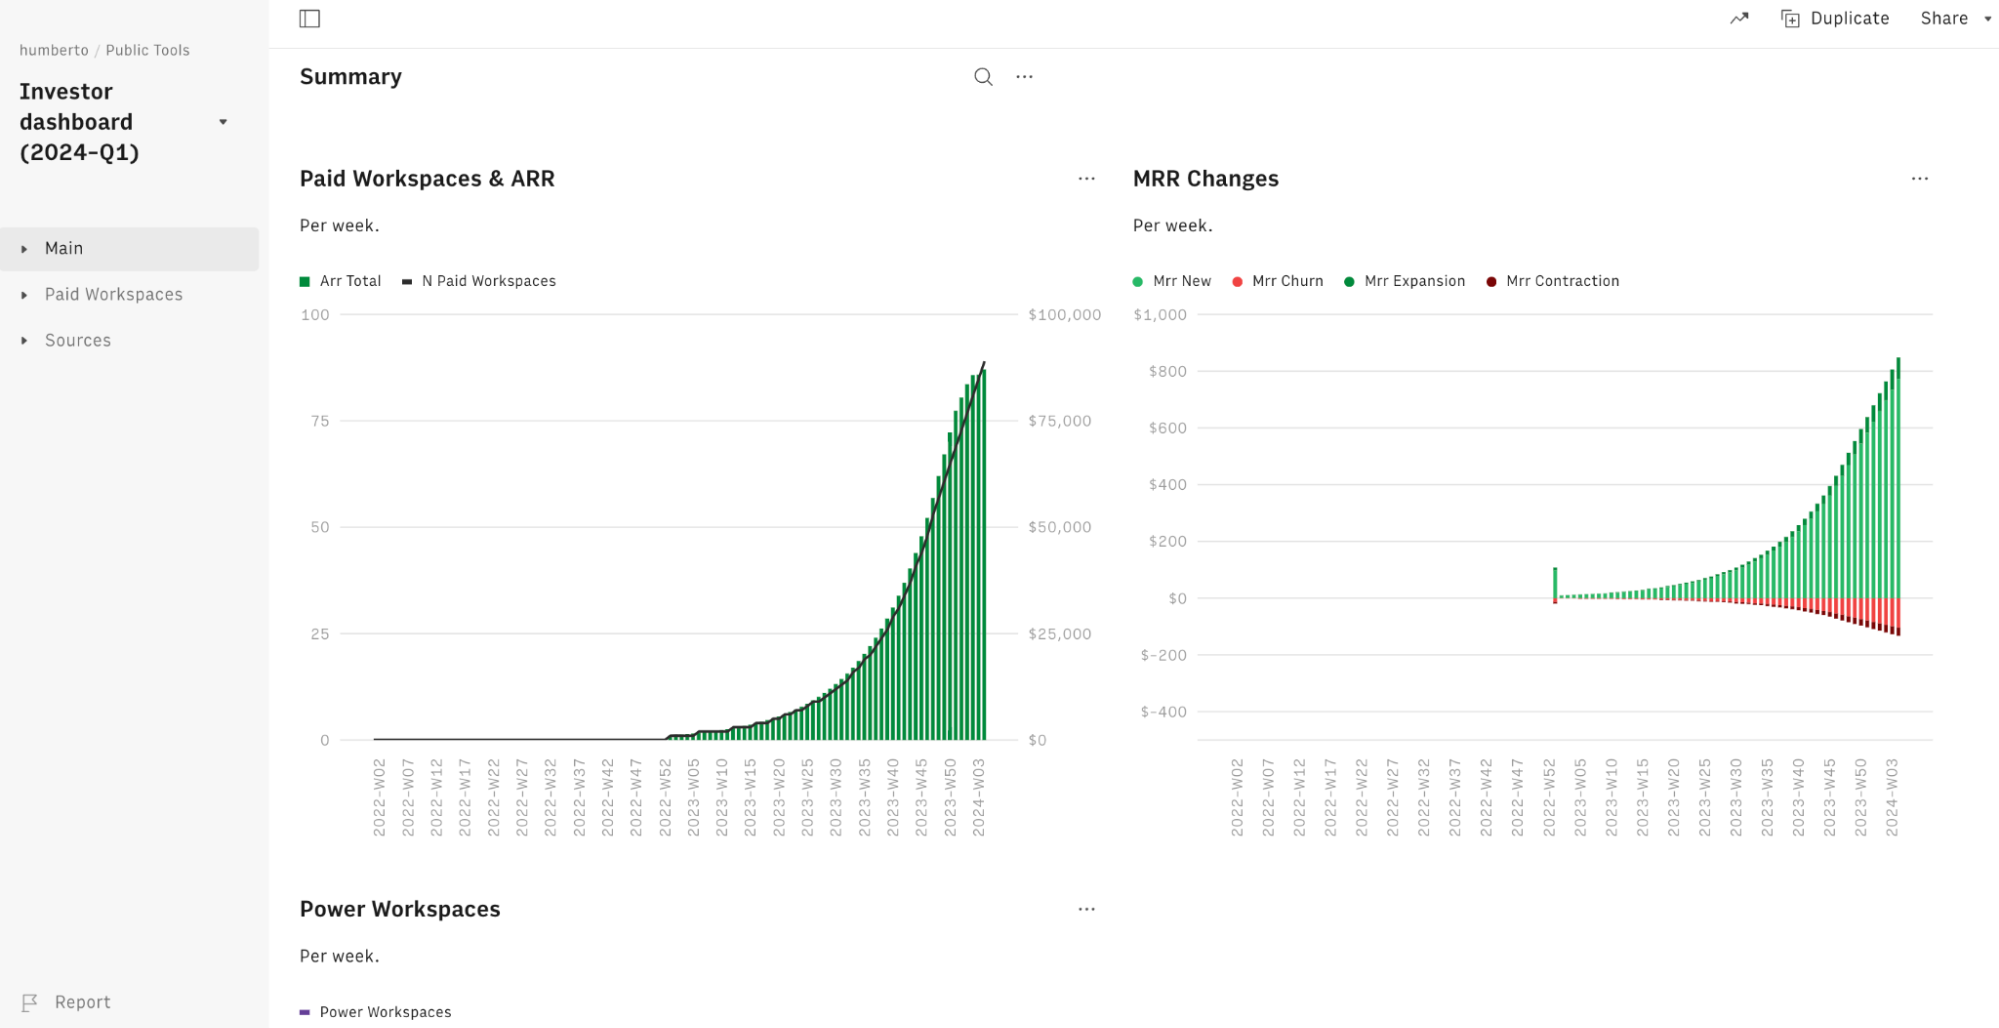
Feature 3. Build Layouts That are Delightful to Share
With Rows, you get the ability to build elegant dashboards that are shareable with your team and clients.
Here’s an example of our investor dashboard (numbers are dummy).
Apart from this, you can also embed tables and charts beautifully on Notion, Confluence, website, wiki, or other internal tools that support iframes with ease.
It’s a simple 4 step process:
Choose Embed in the settings menu located in the right-hand corner of the element you want to embed.
Click the Share Privately toggle.
Click <> Copy code. You can use the Copy link to paste directly into tools that automatically embed via the link - e.g., Notion.
Paste the embed code on your website, wiki, or destination tool.
See for yourself in the following interactive demo:
Learn how to use Embed in the most recent documentation tools, like Notion, Confluence, and Slite.
Pricing
The free plan that Rows gives you the ability to:
Onboard unlimited members
Up to 10 guests
Execute up to 50 integration tasks per month
Create unlimited spreadsheets
If you want premium features and increased limits, Rows also offers 3 paid plans to choose from:
Plus: $15/month/member, up to 25 guests, unlimited integration tasks & daily data refresh.
Pro: $22/month/member, up to 100 guests, unlimited integration tasks & hourly data refresh.
Enterprise: Custom price for advanced API usage and workflows.
How Does Rows Compare to Supermetrics?
When it comes to the data-connector catalog, Supermetrics is a better tool than Rows. That’s because Supermetrics has a wider built-in library of connectors (150+) as compared to Rows (50+).
Another good thing about Supermetrics is that it has a zero-learning curve. It connects your data to a spreadsheet tool that you’re already using.
But Supermetrics solves only one of Rows’ key value propositions – Data integration, enabling familiar tools like Excel and Google Sheets to ingest data.
Supermetrics chose not to evolve the spreadsheet experience along the following dimensions:
Data transformation and analysis (AI function, AI analyst, AI-generated subtitles)
Document-like UI (stacked elements, subtitles/footers, dashboard-like)
Sharing/visualization experience (embed)
If you need a tool that does more than just connect data to a spreadsheet, Rows is your go-to choice as it helps you transform data, visualize data, and talk to your data with AI.
Pros and Cons
✅ Lets you transform and visualize data, even if you’re a non-data-friendly user.
✅ AI functions, Analyst, and subtitles make data analytics easy for beginners.
✅ Has easy-to-use API, so you can import data into Rows from anywhere.
❌ Rows does not have a desktop app, which caps its performance with big chunks of data.
Curious to see Rows in action? Get a head start with our Google Analytics templates, or Google Search Console templates.
Wanted to try out ChatGPT on the grid? Use one of our OpenAI templates and explore how to extract, classify, or clean up data using only natural language.
2. Coefficient

Coefficient is a data connector software that allows you to ingest live data from multiple data sources and warehouses into your Google and Excel spreadsheets. The platform is trusted by over 20,000 companies, including Spotify, Uber, Udemy, and more.
Features
Coefficient offers one-click data import from 40+ data systems and warehouses, including Salesforce, Snowflake, Google Analytics, MySQL, Mailchimp, and other social marketing platforms.
Enable 2-way sync for bulk data transfer to and from spreadsheets to source systems and vice versa.
Use custom fields, dynamic filters, and live pivot tables on top of your cloud systems to harmonize cross-platform data collection and storage into a unified spreadsheet.
Set up real-time Slack alerts for when cell values change or to receive daily or weekly digests highlighting changes.
Pricing
Coefficient’s free plan offers a maximum of three data sources and an import size limited to 5,000 rows. If you want to extend these limits, choose a paid plan:
Starter: $59 per month
Pro: $119 per month
Enterprise: Custom Pricing

Pros and Cons
✅ Coefficient is easy to use and implement.
✅ The free version is good for a small dataset.
✅ Auto-data refreshes provide access to real-time data.
❌ At times, data extraction takes time to render.
❌ Has limited data connectors (compared to Supermetrics and Rows)
3. Metabase
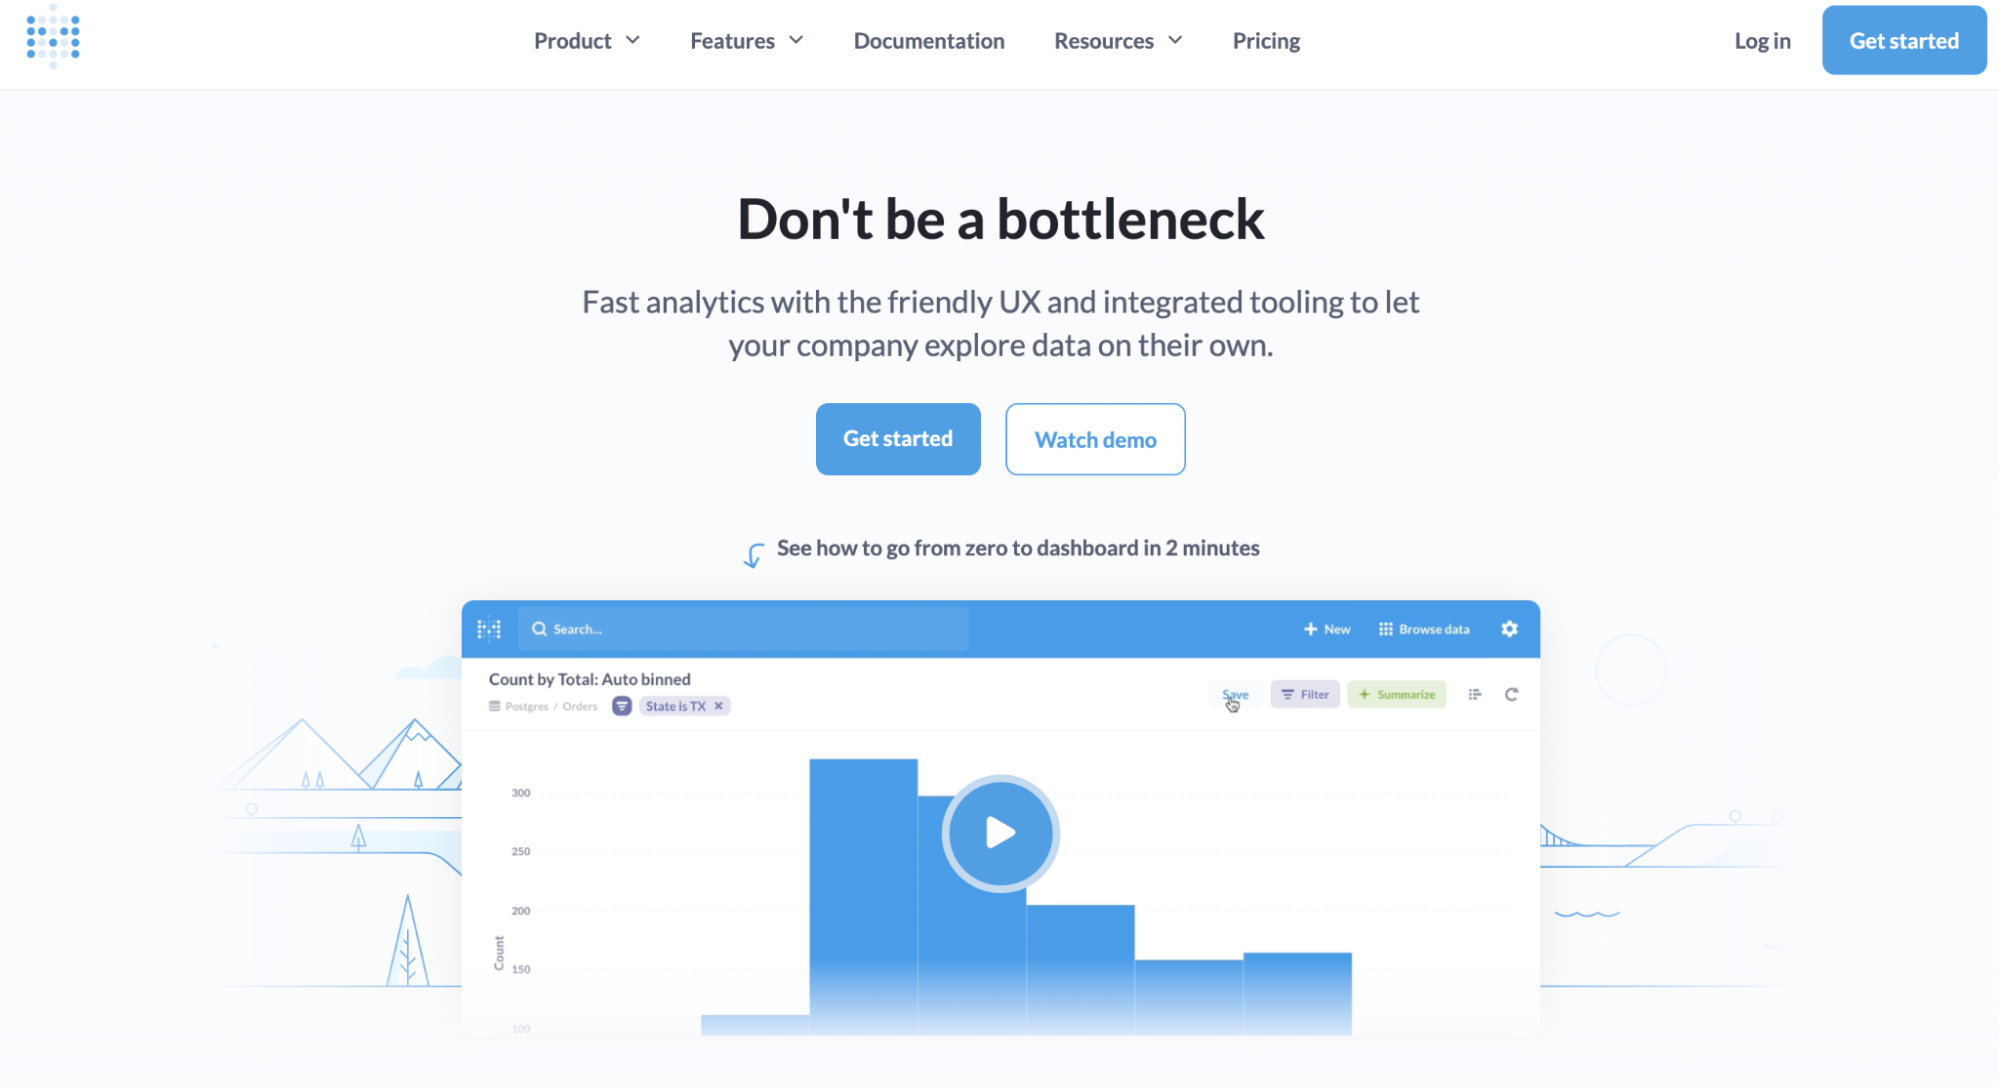
Metabase is a powerful analytics tool for data collection and exploration. It has an intuitive interface that lets you build queries and drill through data at scale — without any SQL knowledge.
Features
Has a library of 20+ versatile data connectors promoting data collection across multiple data warehouses and third-party apps.
Use the visual query builder to drag and drop interfaces, filters, and custom impressions and create queries that automatically clean, combine, format, or ask questions around the database.
Visualize data using interactive dashboards and 15+ stunning visualization types such as charts, bars, graphs, and more.
Metabase's drill-through menu lets you perform granular data analysis, such as zooming in charts for details, breaking down data into categories, applying X-rays, and auto-generating reports.
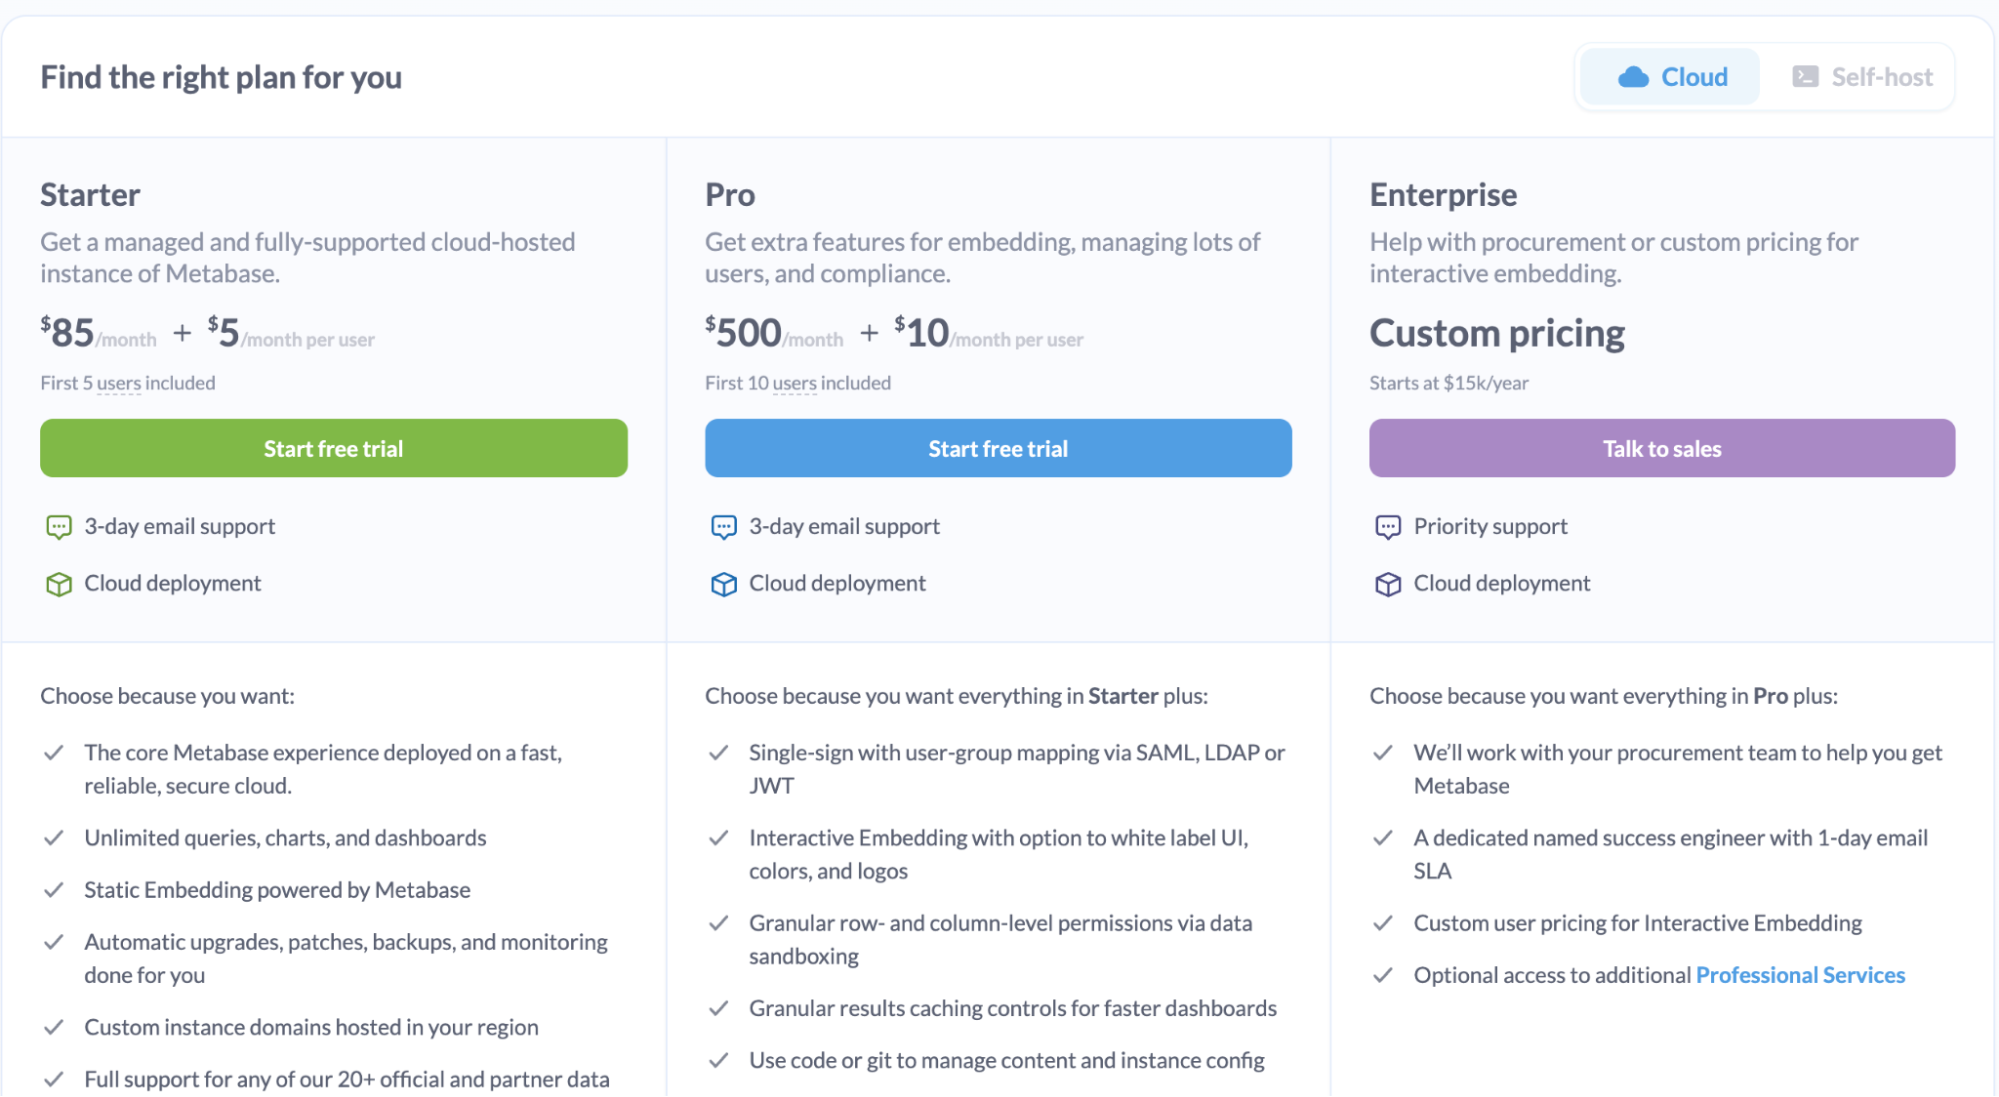
Pricing
Metabase offers two pricing categories: cloud-based and self-hosted. It has a free self-hosted open-source plan with unlimited charts and dashboards. And a 14-day free trial for other paid plans:
Starter (Cloud-based): $85 per month ($5 per user after 5 users)
Pro: $500 per month ($10 per user after 10 users)
Enterprise: Custom pricing
Pros and Cons
✅ Supports CSV file uploads.
✅ A flexible tool with no-code and low-code ways to query databases.
❌ Metabase has performance issues with large datasets.
❌ Doesn't have native integration with Google Sheets.
4. Zapier

Zapier is a no-code automation builder software that lets you build automated workflows (Zaps) between two or more apps. As a Supermetrics alternative, Zapier lets you integrate everything from basic data entry to end-to-end processes in Excel or Google Sheets.
Features
Use Zapier to connect Google Sheets and Excel with 6,000+ third-party apps and data sources, including HubSpot, Typeform, Mailchimp, Pipedrive, Salesforce, Email Parser, and more.
Use the no-code visual automation builder to drag and drop apps, triggers, and action elements and create workflows to harmonize existing spreadsheet data or collect and record new data coming in.
Zapier offers a library of preset triggers and action elements that are supported for creating workflows in Excel and Google Sheets.
Choose from ready-made automation templates to facilitate data ingestion from apps like Typeform, Shopify, and more based on triggers.
Zapier's conversational AI lets you describe what you want to automate in simple language, and it builds the workflow for you.
Pricing
For creating automation and workflows, Zapier offers a free forever plan and five paid plans:
Basic: Free forever
Starter: $29.99 per month
Professional: $73.50 per month
Team: $103.50 per month
Company: Custom pricing

👀 Note: Zapier's pricing increases with the increase in the monthly Zaps you need.
Pros and Cons
✅ Zapier is free to get started.
✅ Integrates with an extensive range of data sources.
❌ Doesn't have tools for data analysis and visualization.
5. Make

Make is a no-code automation builder software that lets you create workflows for automatic data collection, extraction, and analysis. The automation tool is trusted by thousands of users, including top brands such as Spotify, Meta, and more.
Features
Ingest data from 1,700+ data sources, including databases, APIs, and web forms, directly into spreadsheet apps like Google Sheets and Excel.
Has a visual workflow builder that lets you drag and drop apps, triggers, and action elements to create one-off or multi-step workflows between your spreadsheet and other essential apps.
Set up custom workflows to validate incoming data using Regular Expressions (Regex) or apps like NeverBounce and Twilio before storing it in your spreadsheet.
Leverage Make's no-code toolkit to control every aspect of your data workflow execution, ingestion, and formatting.
Makes offers advanced features like data manipulations, filtering, workflow control, error handling, and more.
Pricing
Make offers a free forever plan with a visual workflow builder and 1,000 monthly ops. Other than that, it has four paid plans:
Core: $10.59 per month
Pro: $18.82 per month
Team: $34.12 per month
Enterprise: Custom pricing
Pros and Cons
✅ Make excels at data consolidation.
✅ Offers webhooks to move data back and forth between platforms smoothly.
❌ It has a steep learning curve for beginners due to its many features and options.
6. Looker

Looker Studio is a data visualization and reporting tool for creating appealing reports on consolidated data. Google Sheets offers a native connector to Looker Studio, allowing you to access data stored in worksheets for visualization and reporting purposes.
Features
Looker Studio's native and partner connectors allow data collection and extraction from 1,000+ data sources.
Offers a visual canvas to create customized dashboards based on relevant data sources, followed by spot-on visualization and metrics.
Looker offers an extensive gallery of customizable reporting templates with 40+ preset data visualization elements such as graphs, charts, heatmaps, pivot tables, and more.
Has built-in advanced analytics, enabling you to analyze datasets and gain valuable insights.
Looker Studio offers collaboration features that enable teams to share data, reports, and insights easily.
Pricing
Looker Studio has a free version with self-service business intelligence. Looker Studio Pro is available on a project-based subscription but doesn’t reveal its pricing online.
Pros and Cons
✅ An extensive library of native and partner data connectors.
✅ Has native connectors for Google Sheets.
✅ Has a gallery of data visualization and reporting elements.
❌ Doesn't offer direct integration with MS Excel.
❌ Hard to set up and maintain.
7. Funnel
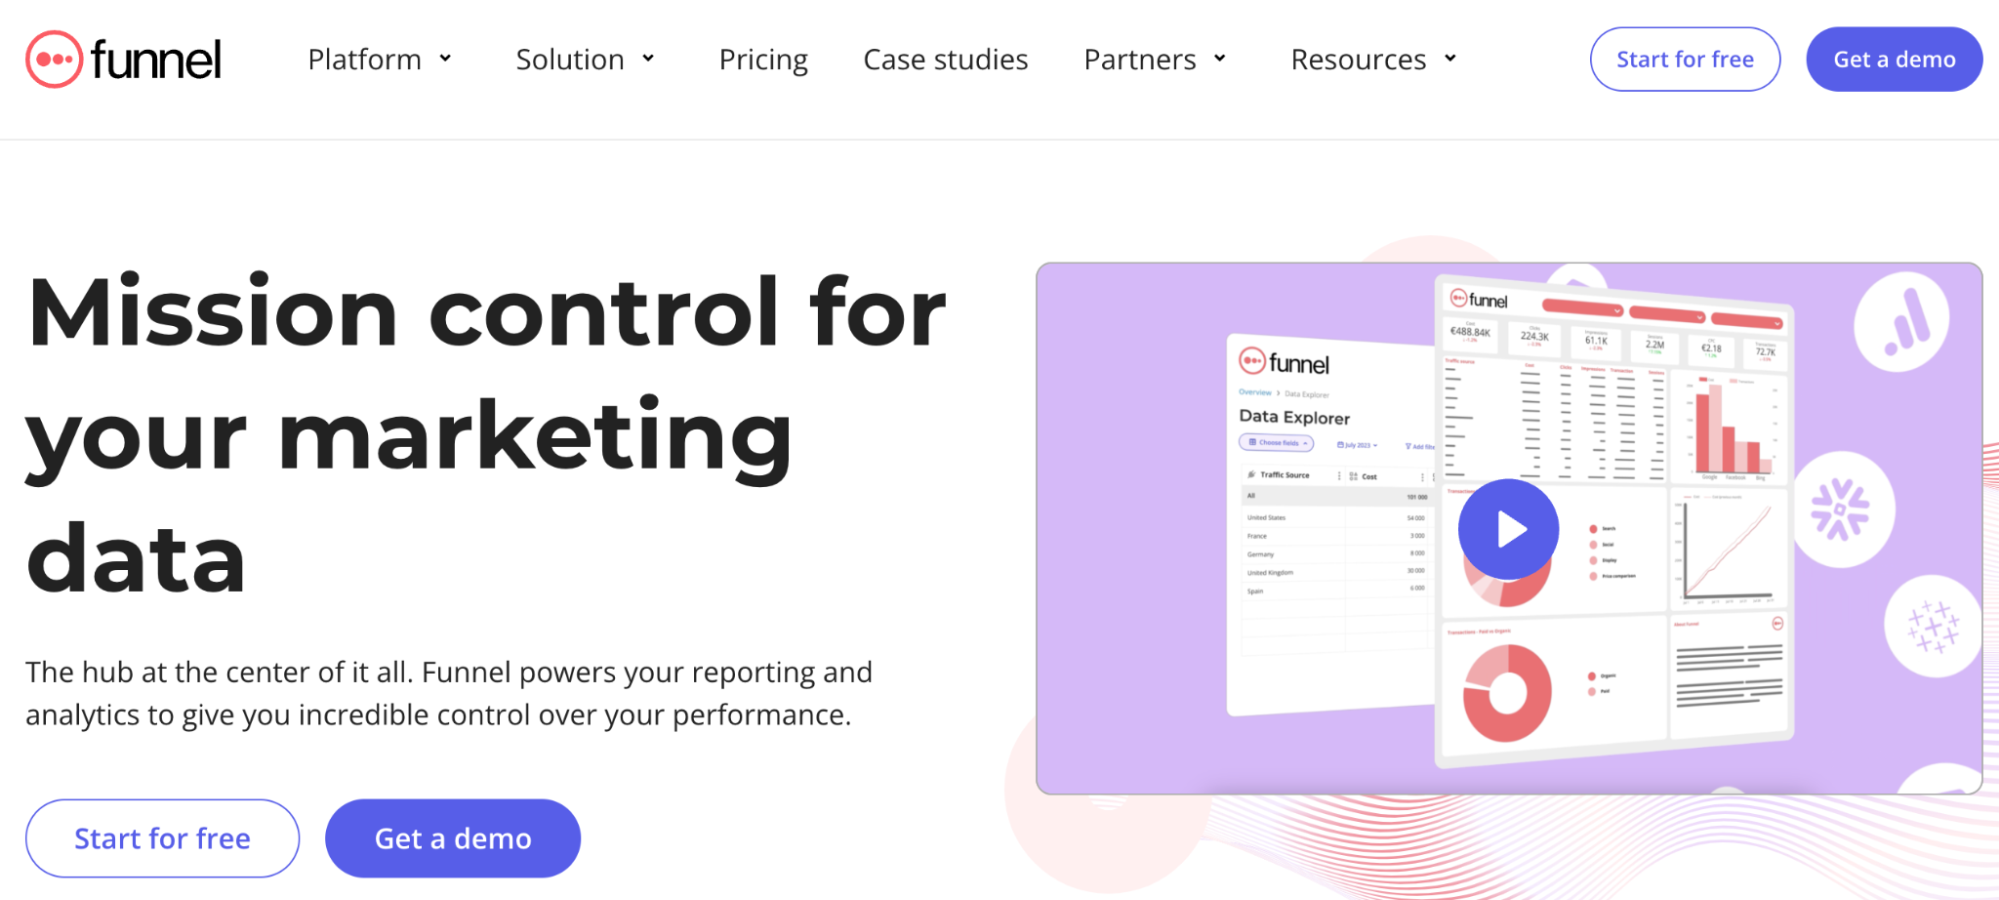
Funnel is an intuitive marketing data automation software trusted by 2,000+ data-driven marketers and brands, including Trivago, Samsung, SuperDry, and more.
Features
Funnel is available as an add-on for Google Sheets and Excel, allowing you to extract relevant data from third-party sources directly into your spreadsheet.
Has a visual automation builder with pre-built rules and logic to combine, segment, clean, and harmonize data as it arrives.
Funnel has 500+ data connectors for popular marketing and sales platforms, including advertising, analytics, CRMs, social, and e-commerce connectors.
Funnel AI offers a comprehensive AI toolkit for efficient data exploration and analysis; for example, the Quick Explorer lets you ask questions about your marketing data, and the AI writer helps write descriptions of KPIs and metrics.
Pricing
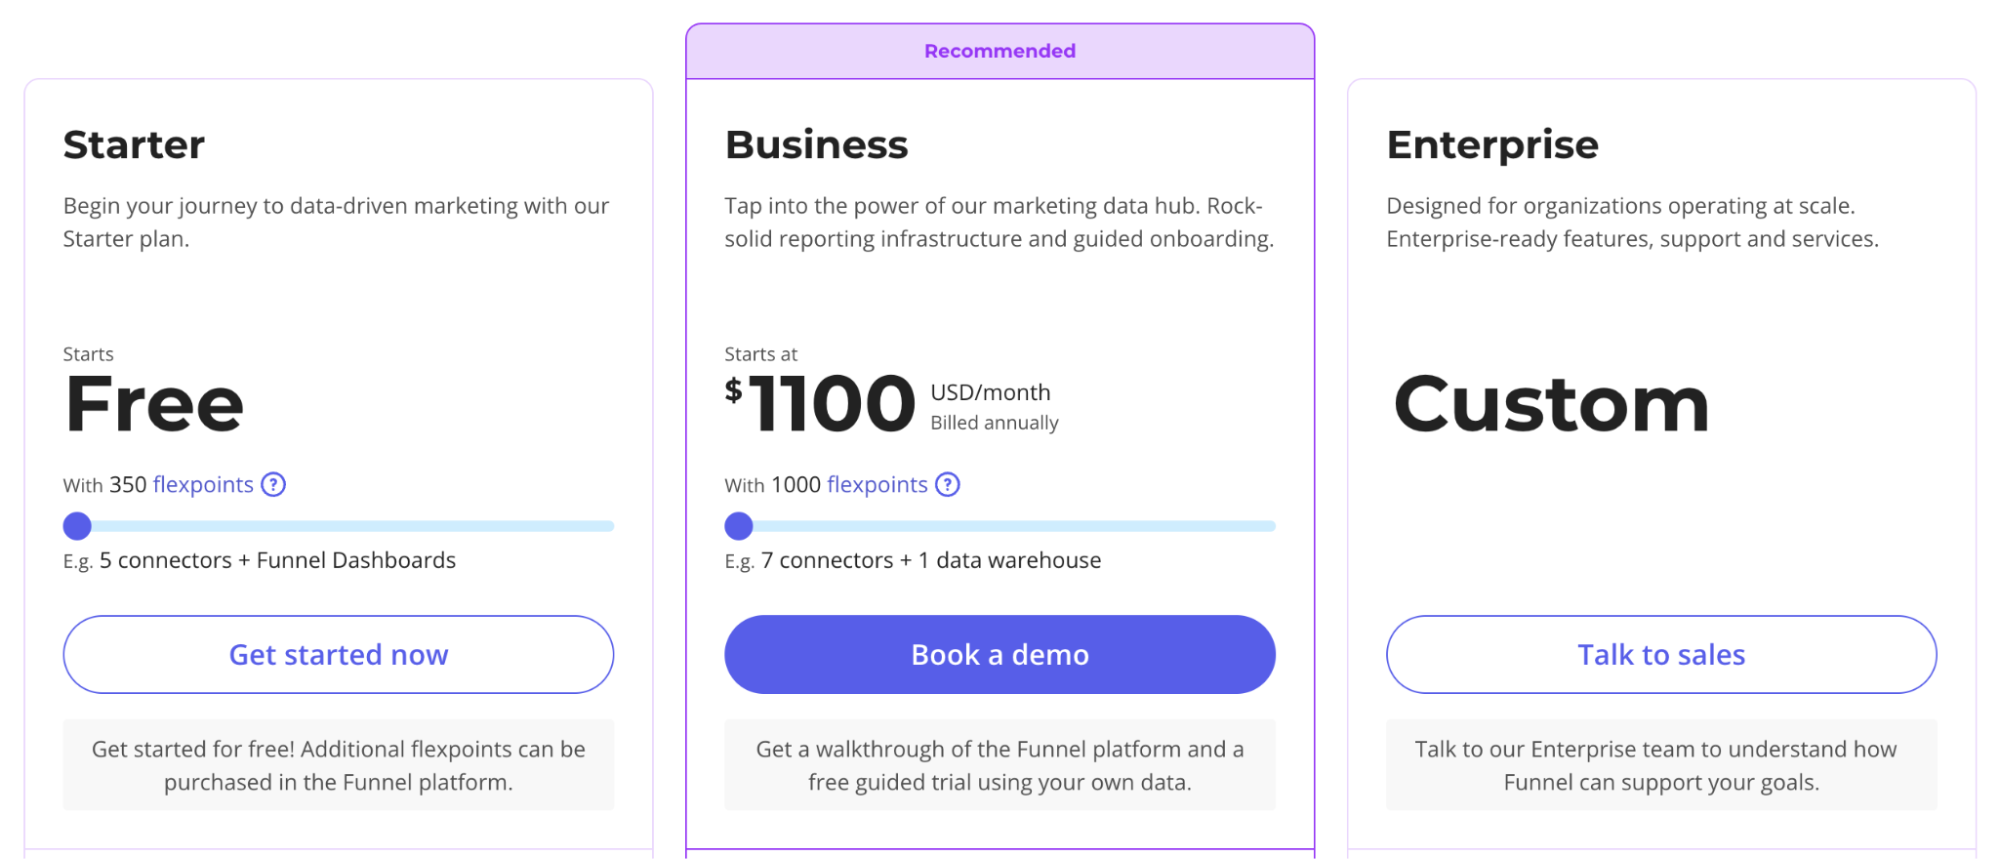
Funnel offers a free forever plan with 230+ core connectors and three data sources, including Google Sheets and Excel. Other than that, Funnel has two paid plans:
Business: $1100 - $2585 per month
Enterprise: Custom pricing
Pros and Cons
✅ Funnel's free plan allows connecting core marketing data to spreadsheet tools like Sheets and Excel.
✅ Has an intuitive interface, making it easy to use and set up (with a minimal learning curve).
✅ Provides custom connectors on request.
❌ The incremental pricing model may prove costly for SMEs (you need to frequently pause data sources to ensure you're not overusing data sources/export).
8. Improvado

Improvado is an AI-powered marketing and analytics platform for teams looking to automate complex marketing intelligence and reporting.
The platform’s full-cycle analytics lets you extract, transform, and turn data into decision-making instruments.
Features
Easily extract data from 500+ data sources, including ad platforms, CRMs, martech tools, spreadsheets, and other flat files.
Choose from 40K+ metrics and dimensions to collect only relevant data from individual or bulk sources simultaneously.
Ensure real-time data collection by scheduling auto-sync on a daily or hourly basis.
Improvado's AI-driven data transformation assists in normalizing data while simplifying data mapping and modeling without any data engineering or SQL prerequisite.
Pricing
Improvado's pricing is not mentioned on its official website. However, you can book a call with its sales team to get customized quotes for your business needs.

Pros and Cons
✅ Comes with integrated AI capabilities.
✅ No restriction on the number of data sources, regardless of your subscription type.
✅ Lets you do historical data sync per data source.
❌ No free version is available.
❌ Improvado add-ons for Google Sheets and Excel are available by request only.
9. Power My Analytics

Power My Analytics is a data integration platform that promotes data collection from multiple data sources and marketing apps to distribute it across spreadsheet apps.
Features
Supports data ingestion from 40+ sales, social, and marketing platforms, including HubSpot, Facebook, YouTube, Mailchimp, and more.
Has a variety of e-commerce connectors that enable you to load data from online marketplaces like Shopify, WooCommerce, and Amazon Seller Central directly to your spreadsheets.
Power My Analytics offers a single-pane-of-glass view, allowing enterprise-wise data visibility and management from a centralized dashboard.
It offers a gallery of professional-looking reporting and dashboarding templates for marketing, advertising, and SEO purposes embedded with all necessary yet granular metrics.
Pricing
Power My Analytics offers a 14-day free trial for all of its four pricing plans:
Single: $14.94 per month
Business: $39.95 per month
Pro: $99.95 per month
Enterprise: Custom pricing

Pros and Cons
✅ A centralized dashboard for managing cross-platform data.
✅ Has a wide range of reporting and dashboarding templates.
❌ No free version is available.
❌ Users find the add-on clunky when compared to the Supermetrics Google Sheets add-on.
Automate Data Analysis with Rows
The tools mentioned above are all great alternatives to Smartsheet and help you resolve its drawbacks.
Gathering data, analyzing, and then visualizing it is an important part of any business to make data-driven decisions.
But which Supermetrics alternatives should you try out?
Well, there’s no better way than signing up for free trials and judging products for yourself.
If you or your team don’t have the time to try every product on our list, go to Rows.com, import data, automate your report, and see if it's the right match!