How to use Google Search Console for Keyword Research in 2024

In this guide, we will explore two methods to conduct keyword research using Google Search Console, a crucial tool for analyzing how your website behaves when searched on Google.
Keywords are the cornerstone of SEO, acting as direct insights into what your audience is searching for and significantly influencing your page ranking on Google. Keyword research is the process of unveiling insights about which queries bring users to your website, discovering how the content you produce matches visitors' intent, and spotting new potential growth opportunities.
Google Search Console names those keywords as 'queries' and, through a variety of possible reports, provides actionable insights on your organic growth tactics and strategy.
In this post, we will cover how to use Google Search Console's interface and how to leverage the Rows interface for more dynamic analysis and deep dives.
We will outline:
Method 1: Using Search Console Interface
Navigating the Performance Report
Analyzing Search Queries
Exporting Data for In-depth Analysis
Method 2: Using Rows to do keyword research
Why use Rows for keyword research
What is Rows
Use the Google Search Console Keywords Research Template
💡 With Rows, you can pull data directly from the Search Console and take advantage of the flexibility of the spreadsheet to easily surface insights about your keywords, build charts, and embed data in your Notion doc. Get a head start with our keyword research template.
How to use Google Search Console for SEO and Keyword Research
Method 1: Using the Google Search Console Interface
Navigating the Performance Report
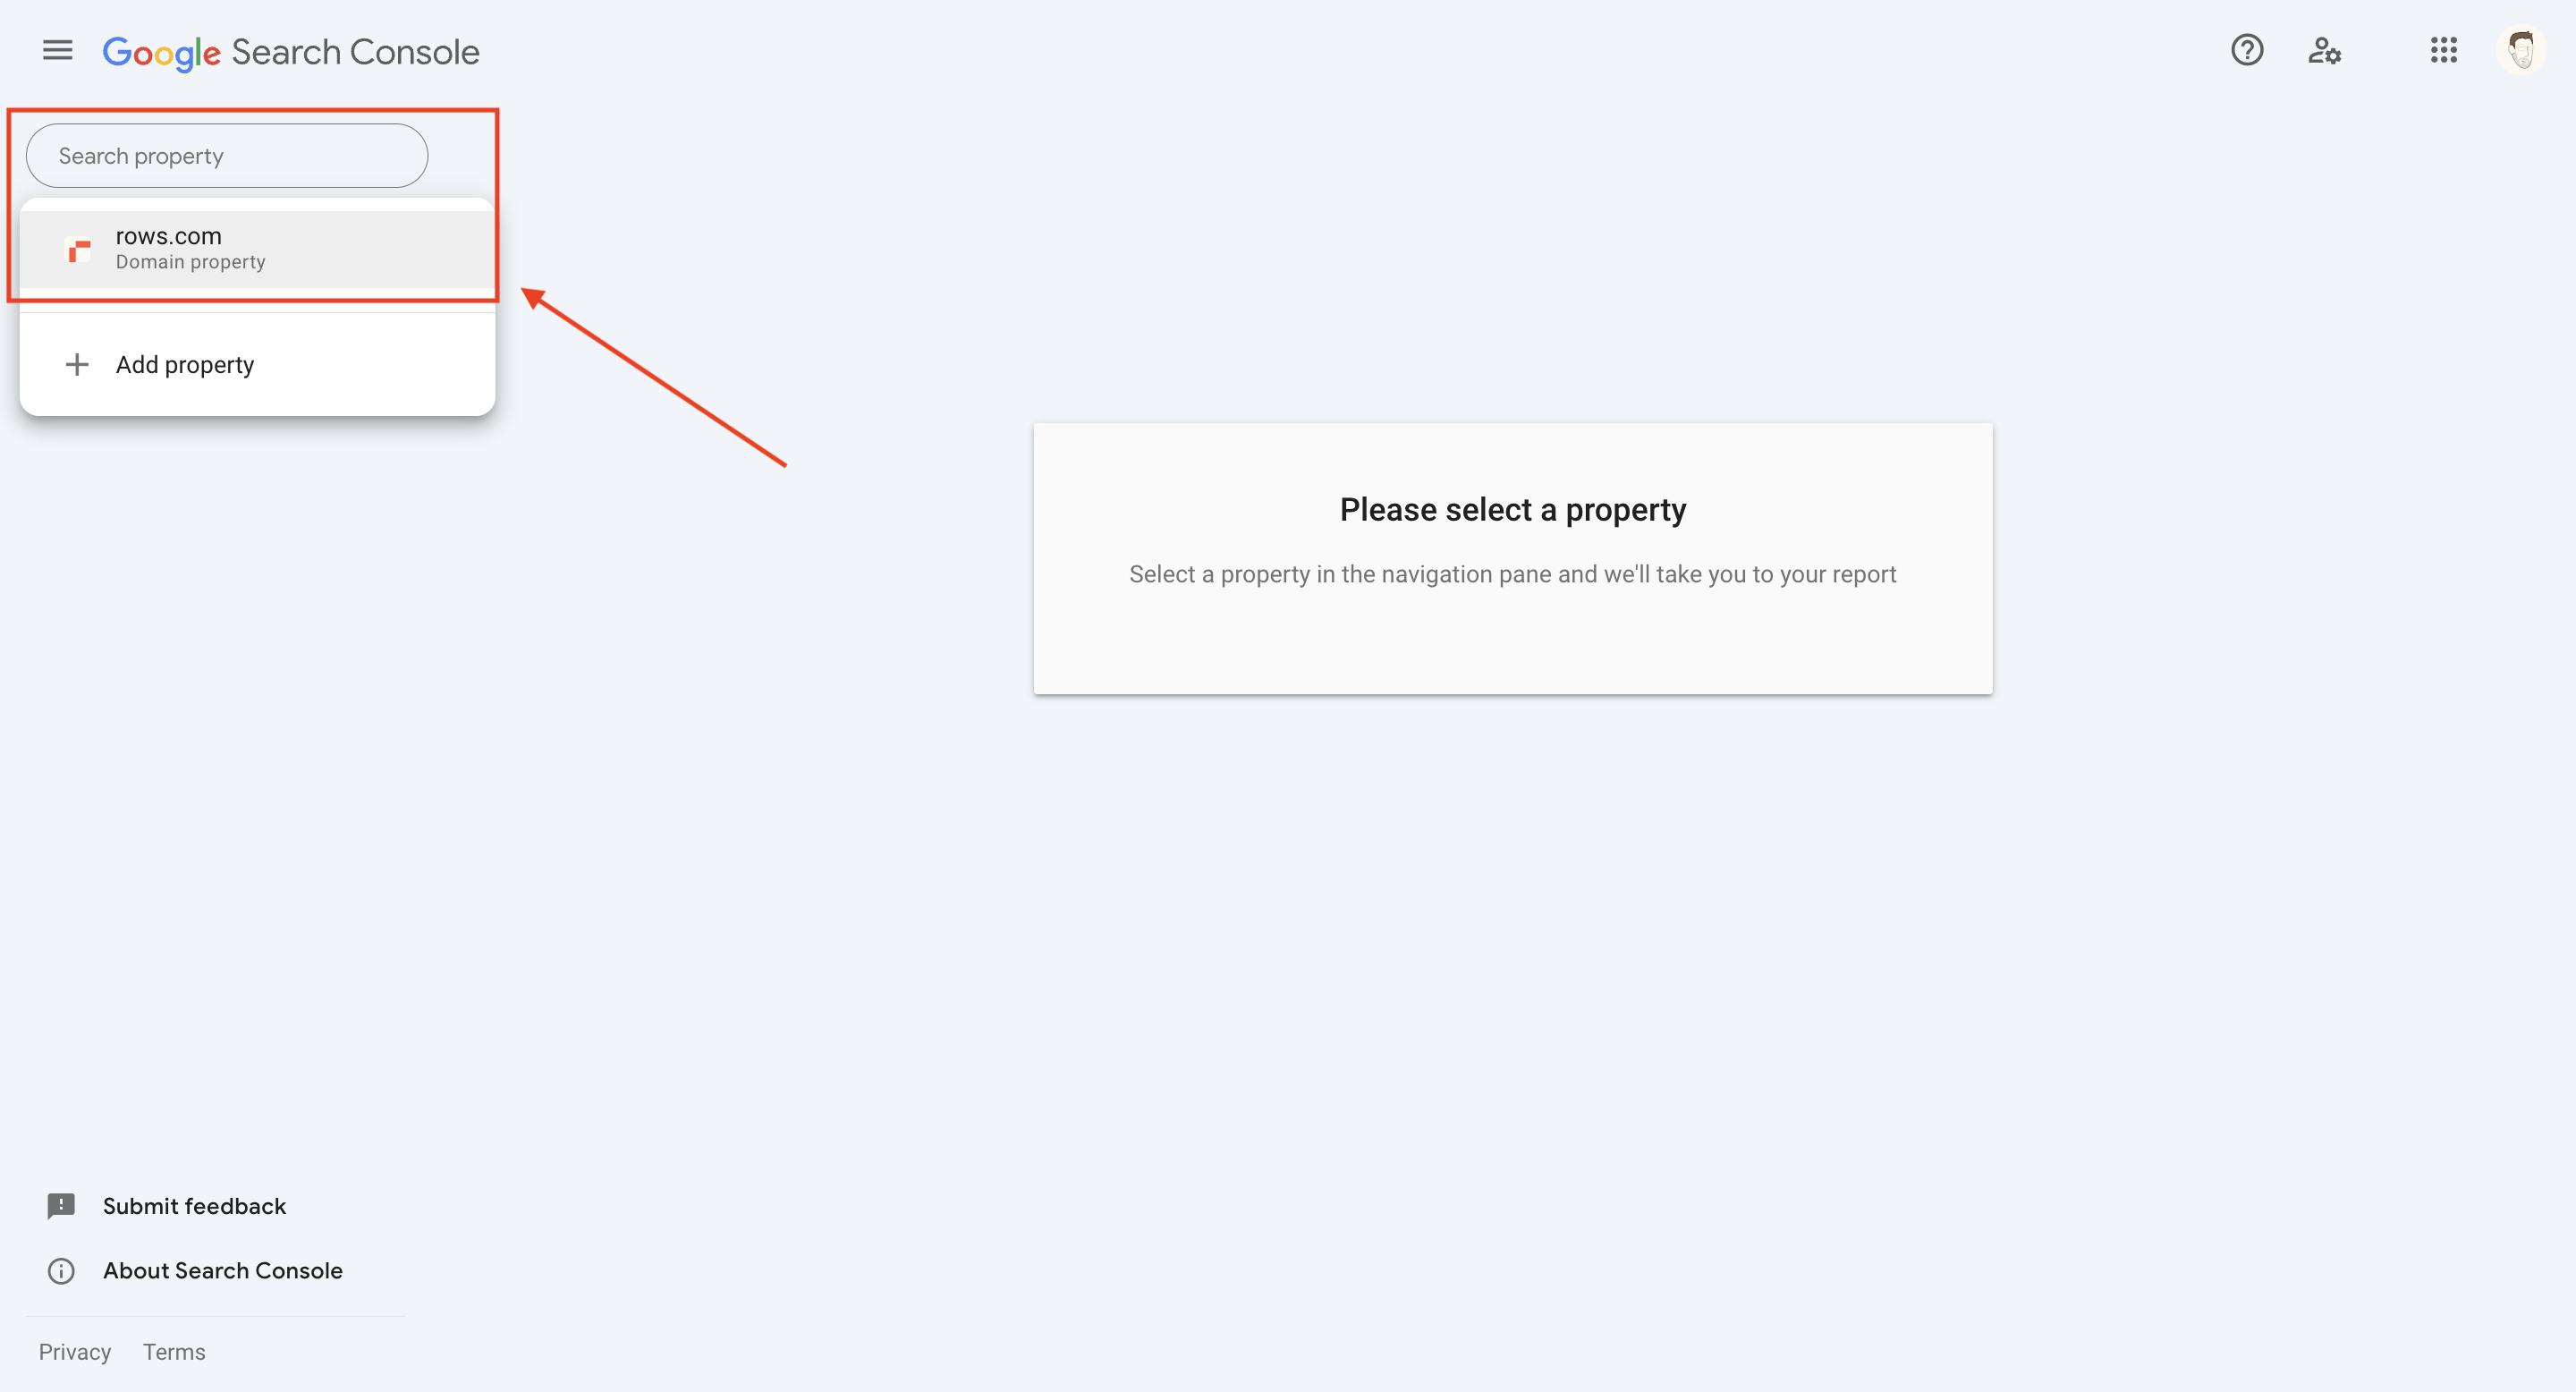
To begin, log into your Google Search Console account and select the property you want to analyze.
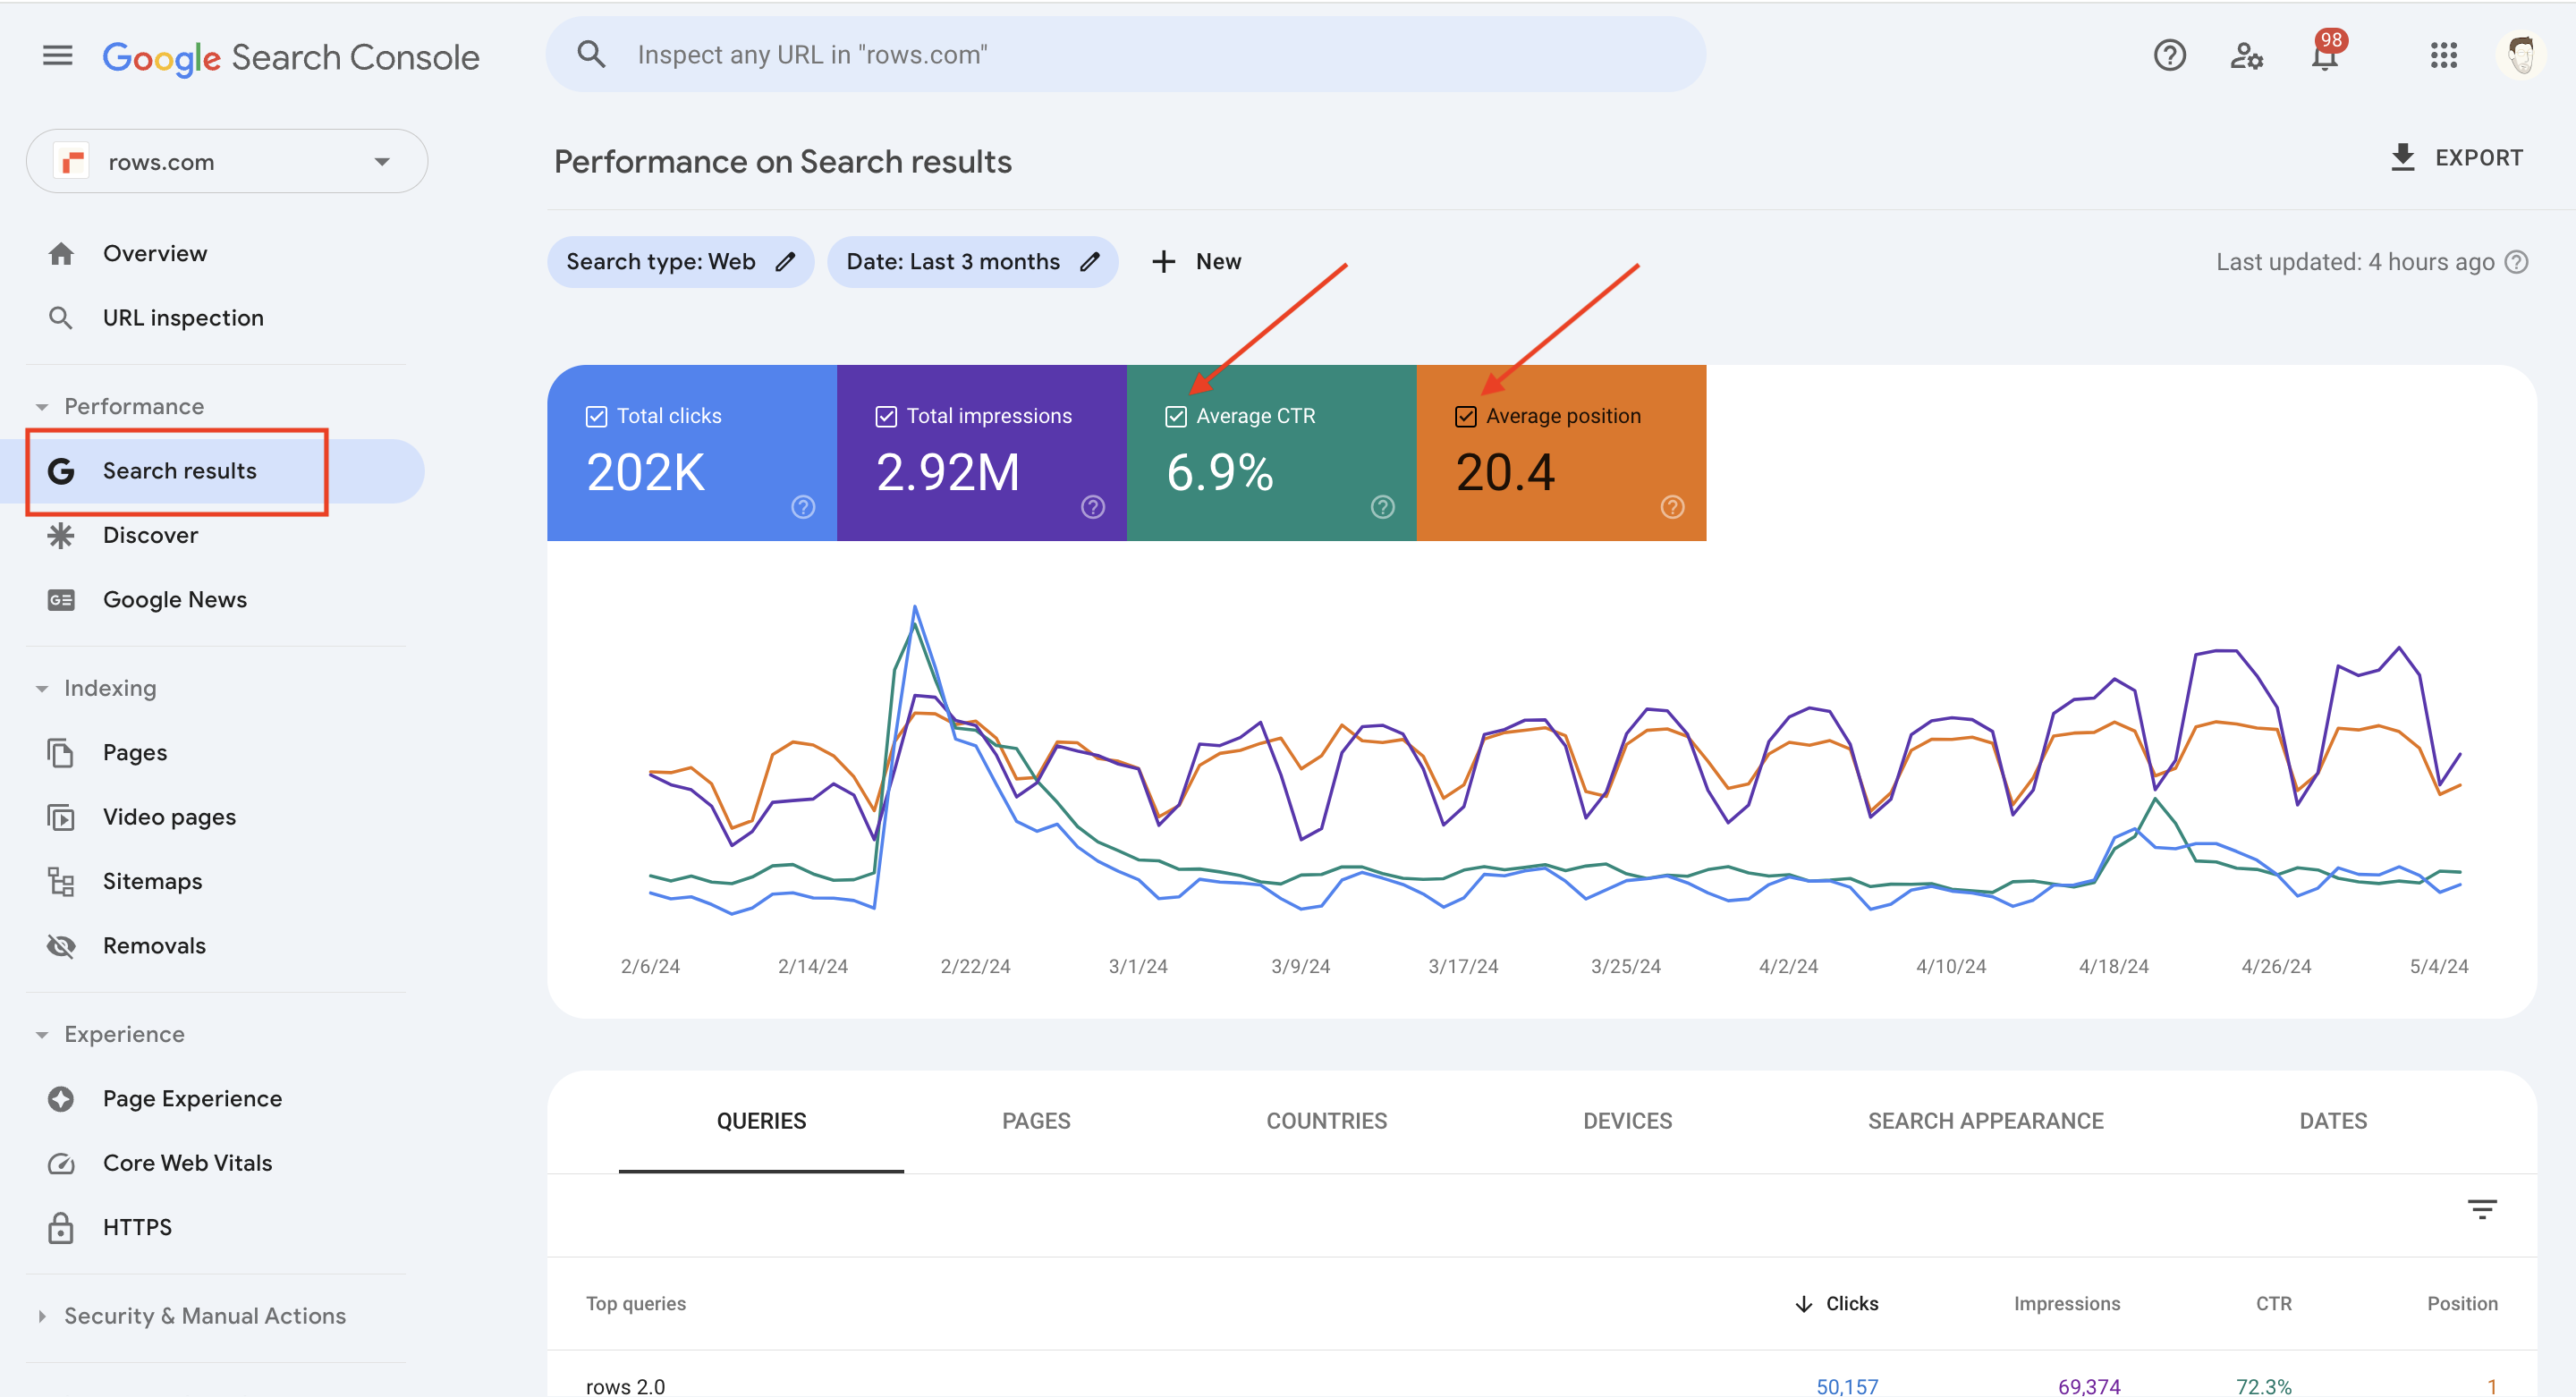
Once logged in, go to the "Performance" section where you can see search traffic data. This report provides insights into the queries that bring users to your site: check the boxes of CTR and Average Position to include the metrics in the report and have a complete performance outlook.
Analyzing Search Queries
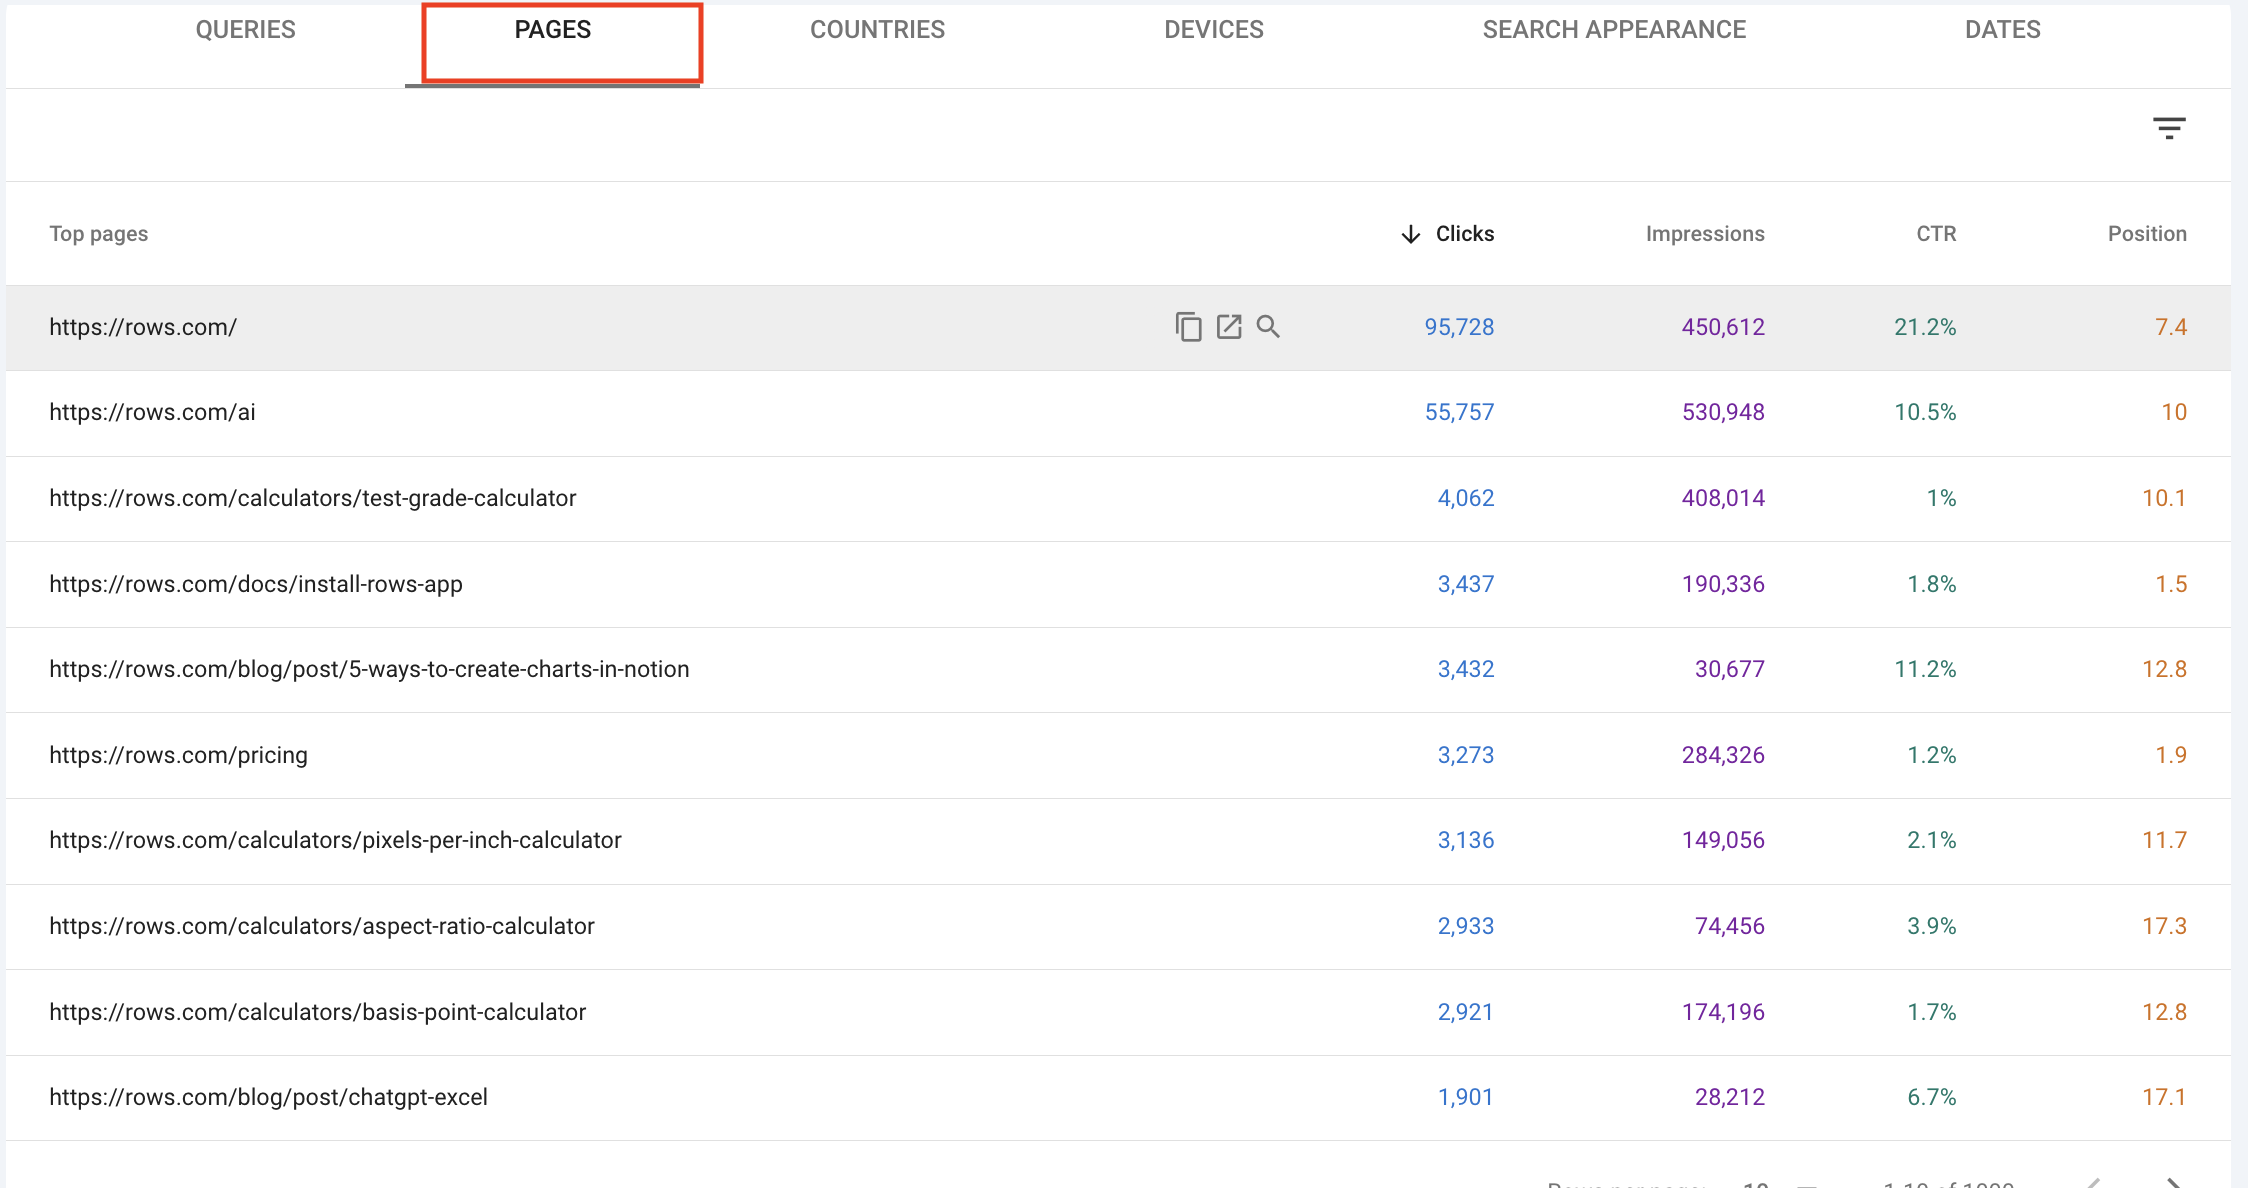
The Performance report can be broken down across 5 different dimensions: use the Page dimension to check which pages are getting the most clicks or have the highest ranking.
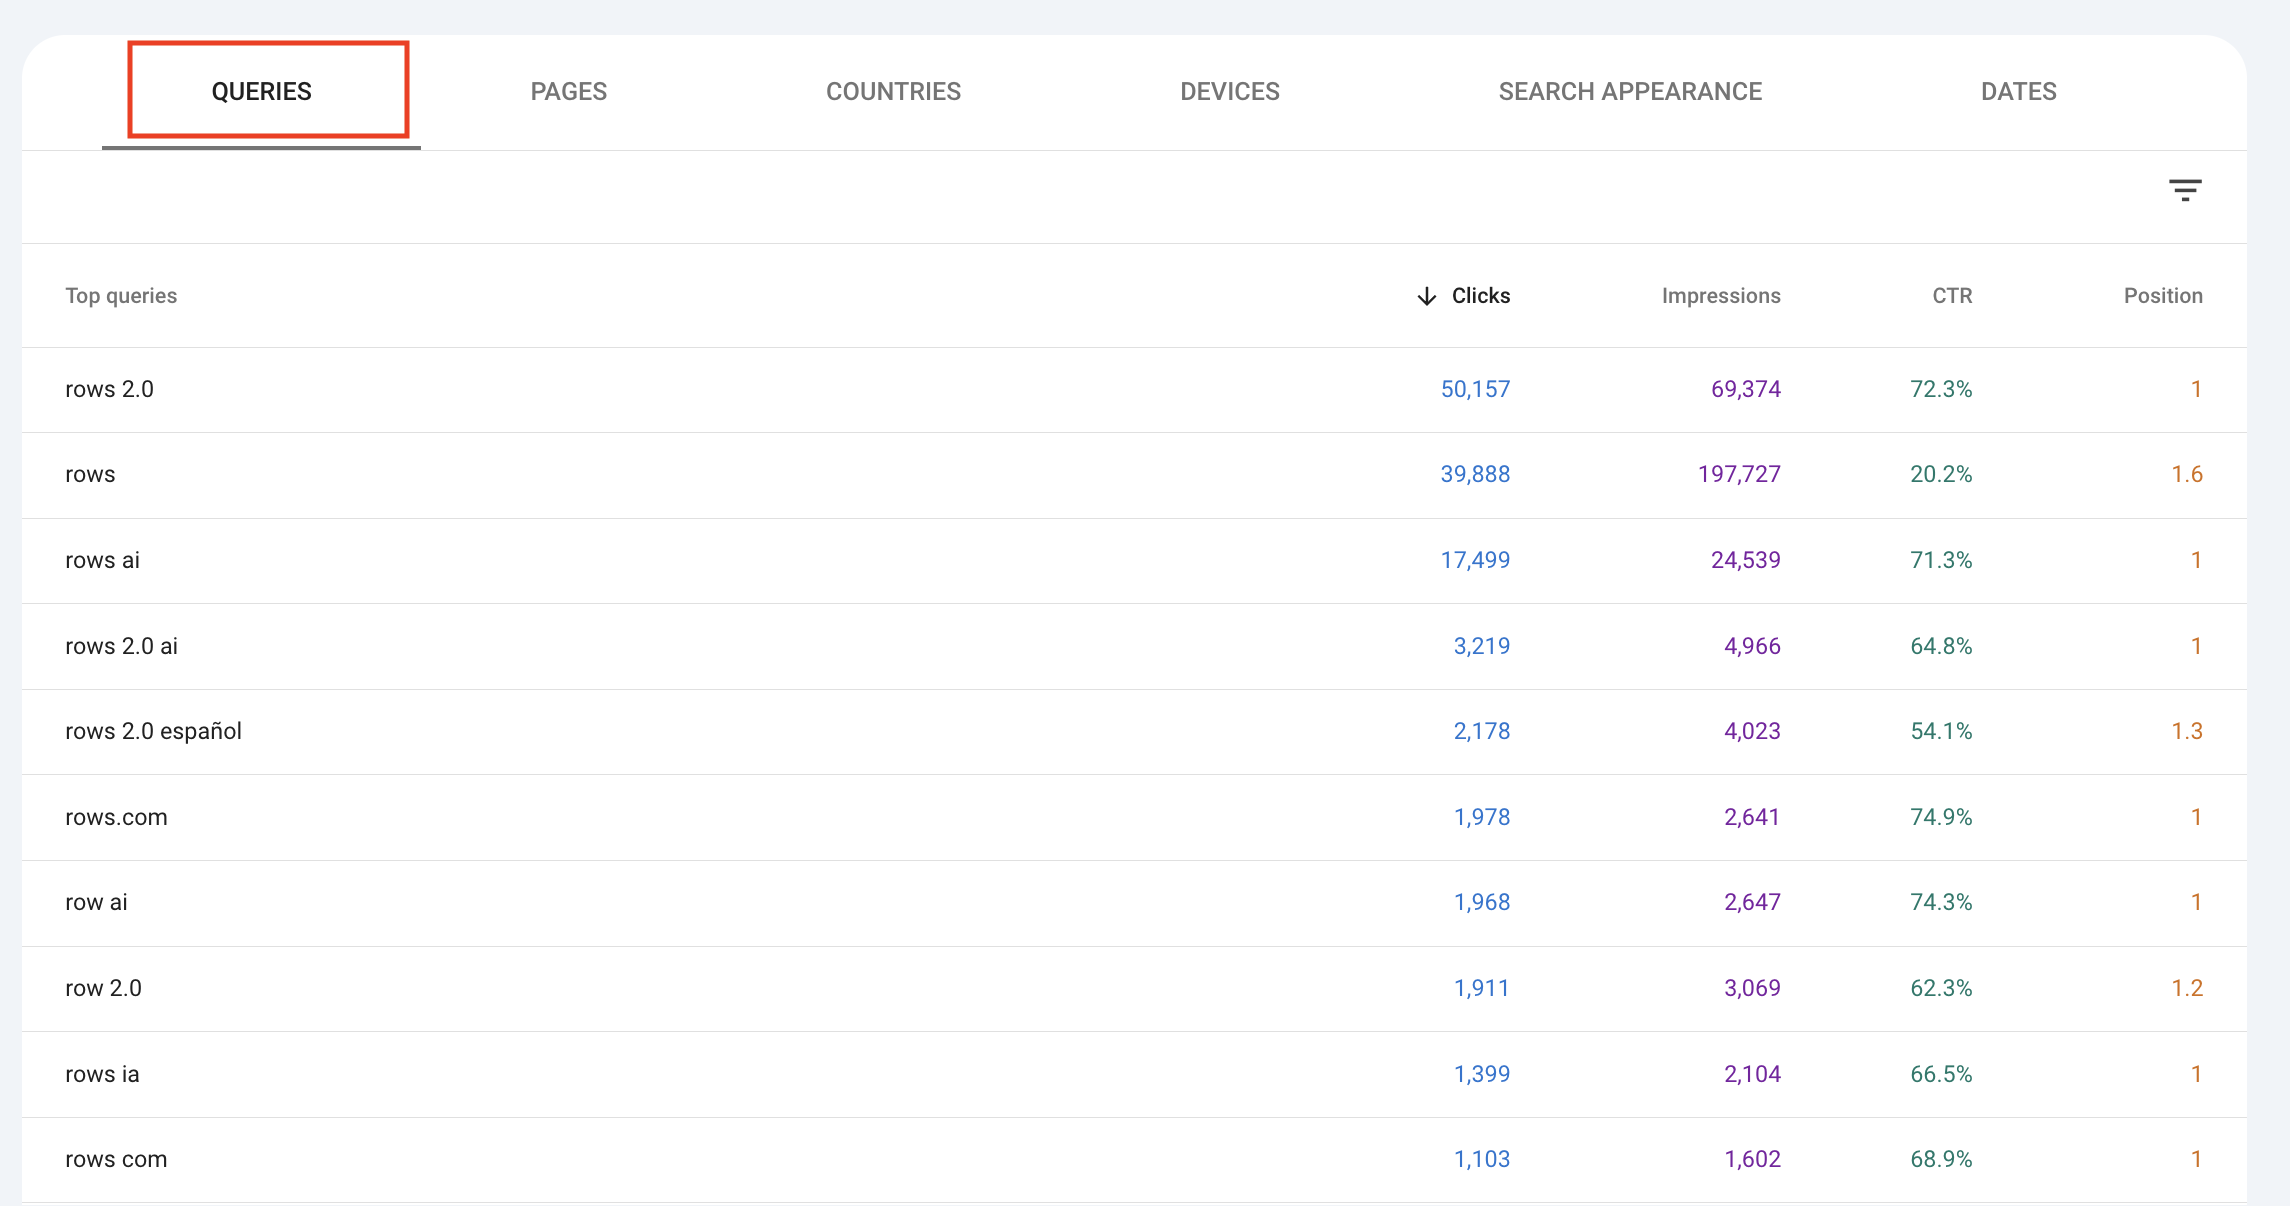
Instead, choose the Queries (i.e. keywords) to see what searches bring the most or best-quality traffic to your site.
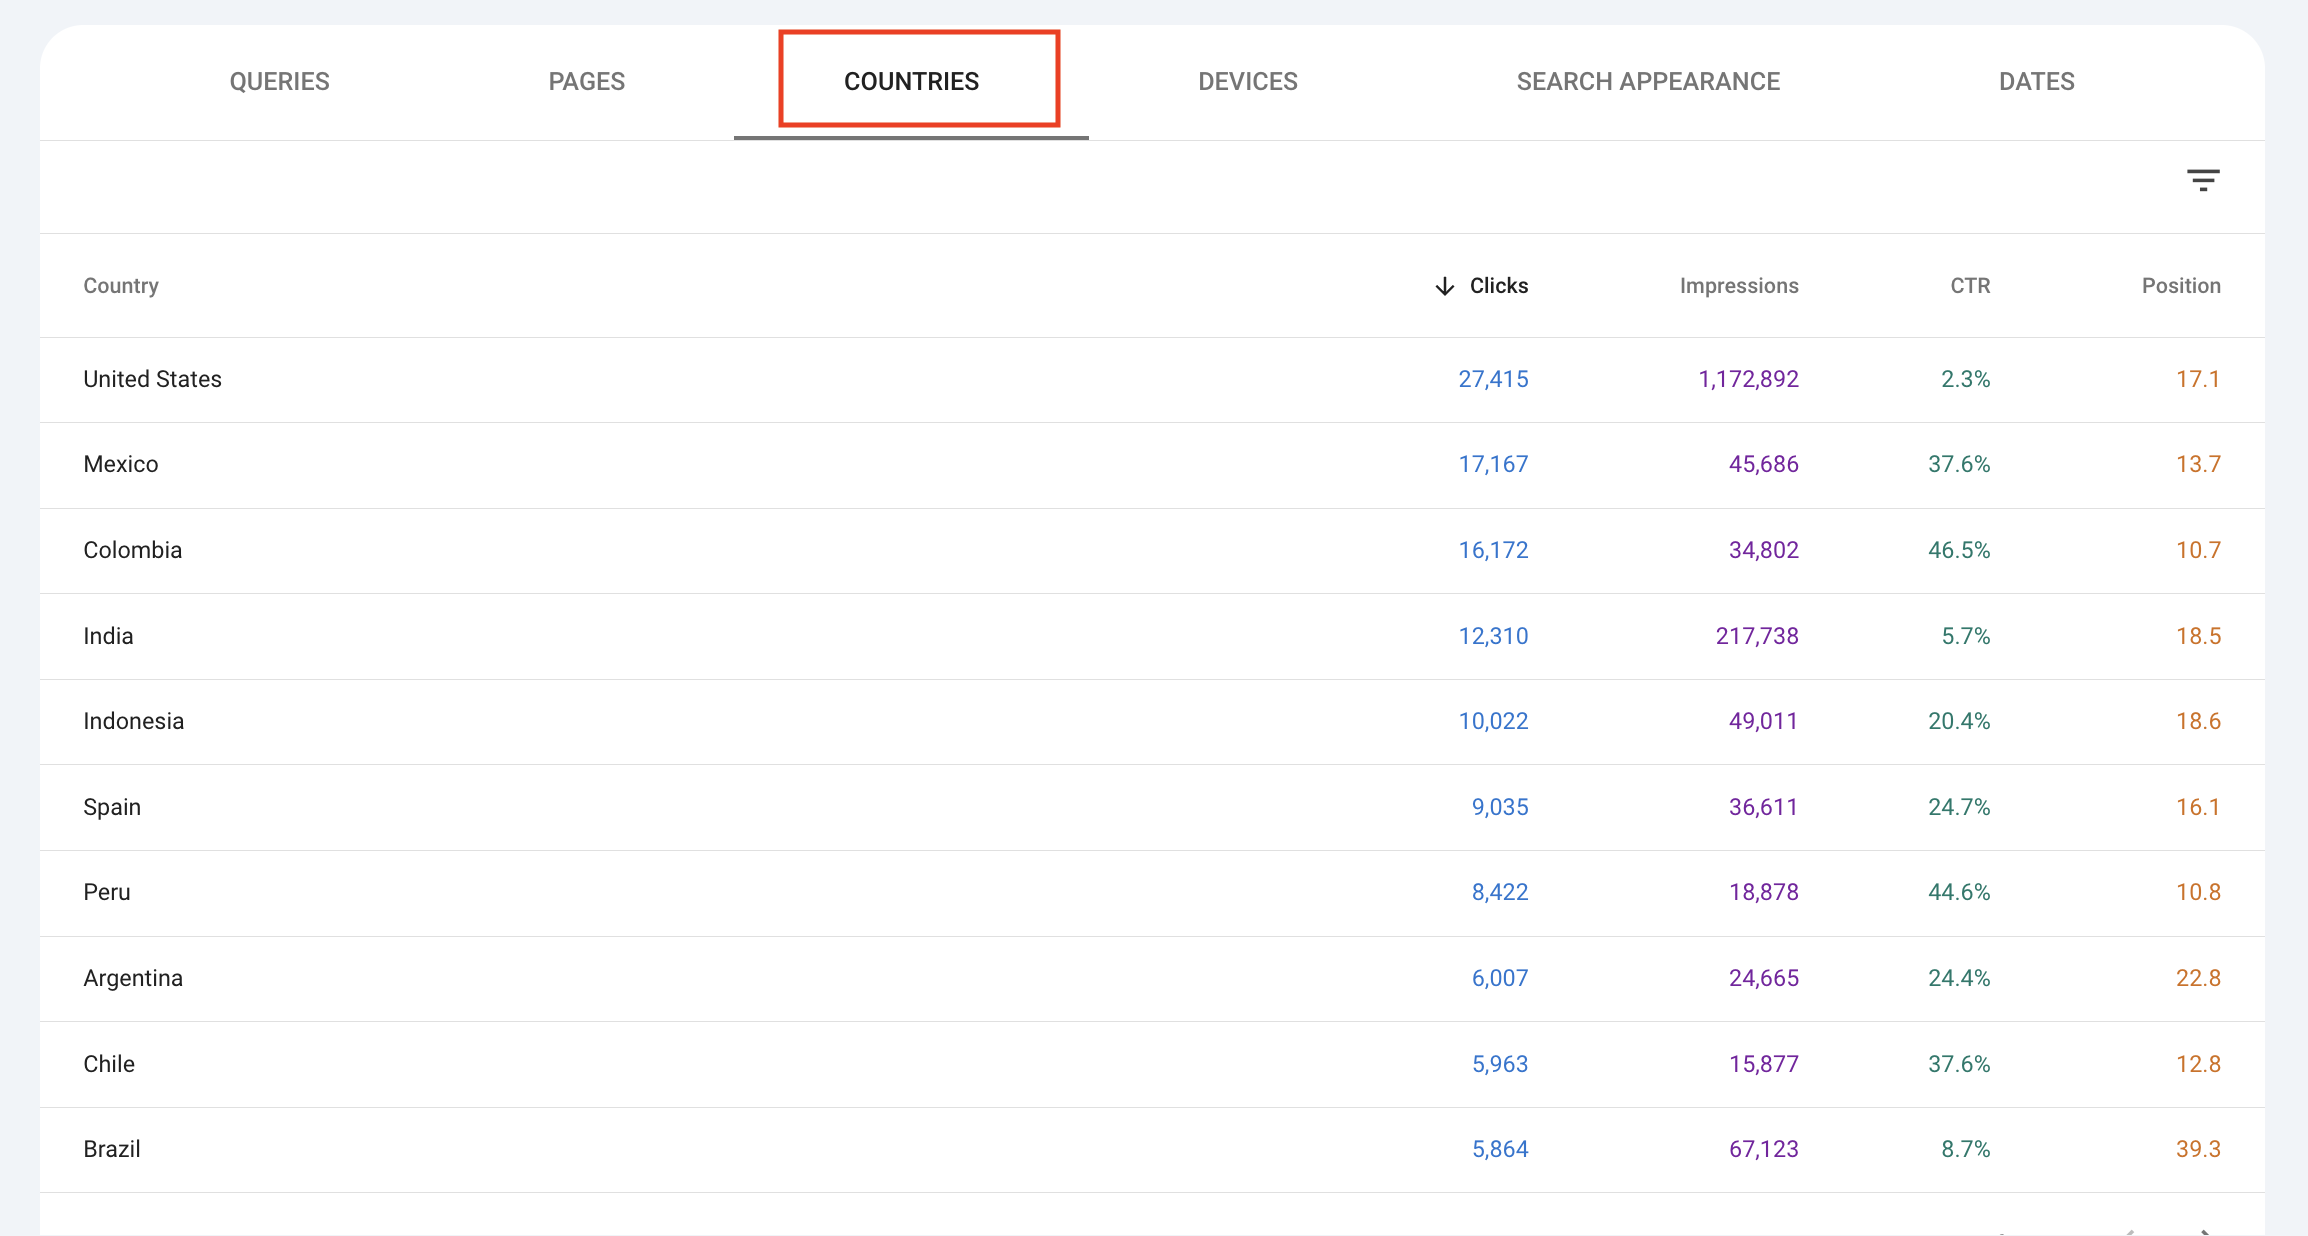
Use Country to see if some countries are more relevant for your strategy.
Above the data, you can pick a date range (default is last three months) and pick the preferred type of search (image, web, or video). You can also filter for specific Query, Page, and Country values, for example, obtain the KPIs of a group of pages only (e.g. Page contains "/blog"), by clicking on the +New button just above the report
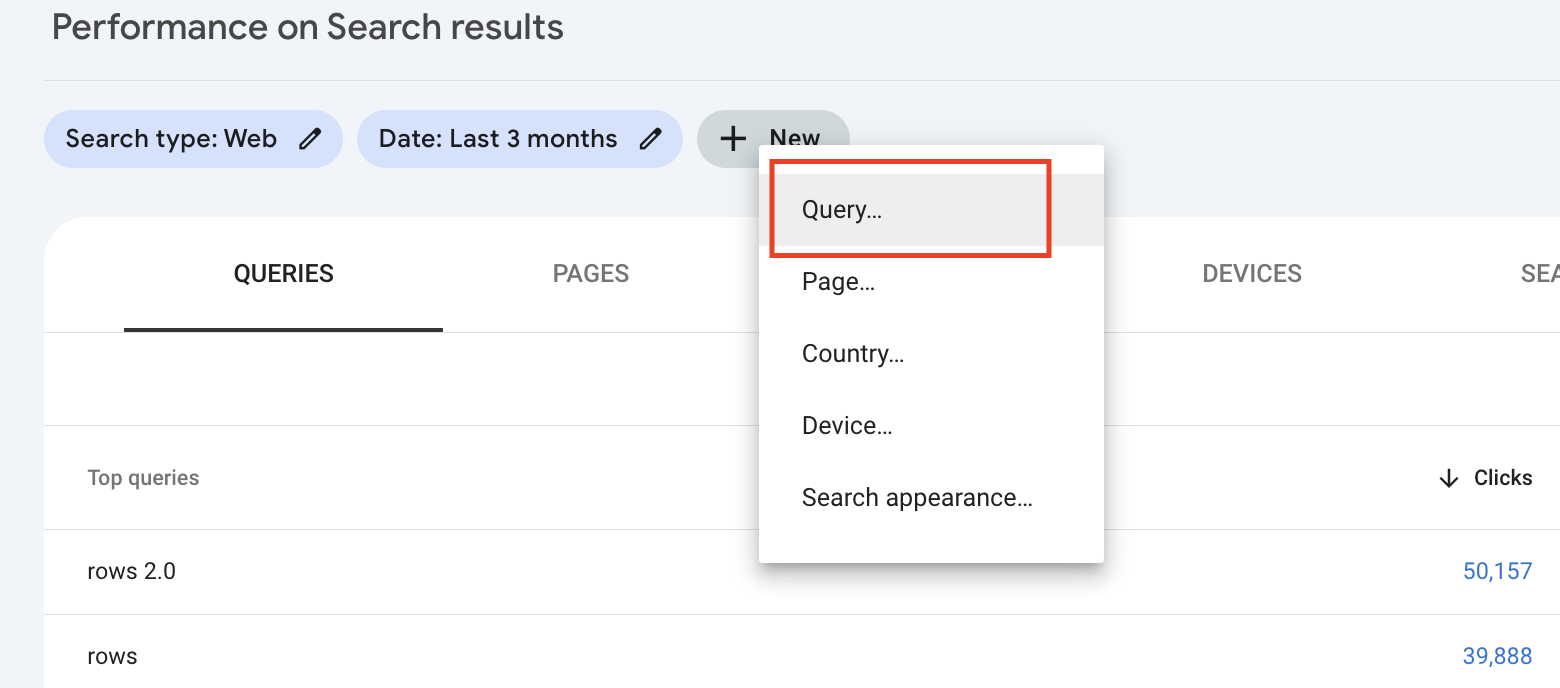
Choose then an operator (e.g. "equals" or "contains") and input the path or keywords. An interesting way of slicing data is to distinguish between branded vs non-branded keywords, that is queries that contain vs not-contain your brand name (for us 'Rows').
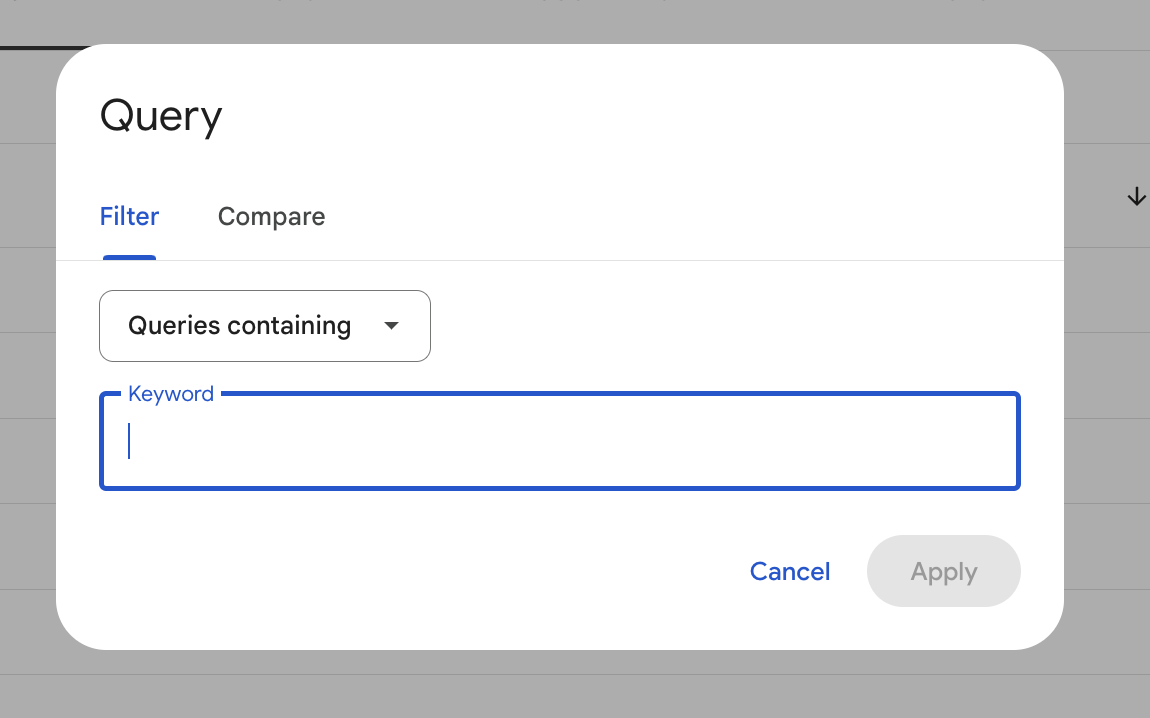
Looking for traffic that comes only from non-branded keywords is a good measure of the effectiveness of your content marketing effort (i.e. content that is produced to bring people that do not know your brand to try your product targeting jobs-to-be-done, use cases or competitors)
Exporting Data for In-depth Analysis
In the above paragraph, we reviewed the views Google Search Console makes available to gather insights about your website search performance.
However, the devil is in the details: you can surface many additional insights by manipulating the above tables through sorting and filtering or combining multiple dimensions.
One way to do it freely is to export the data from GSC to a CSV file and use it on a spreadsheet. But it's cumbersome and time-consuming. In the following method, we will outline how you can use Rows to gather more actionable insights for your SEO strategy, using the same data made available by Google Search Console through its API.
Method 2: Using Rows to do keyword research
Why use Rows for keyword research
The standard reports offered by Google Search Console provide a good starting point for understanding the basic performance of keywords.
However, it's by manipulating, sorting, and pivoting those data that further actionable insights come to life. To do so, you most likely want to use a spreadsheet. However, exporting and importing CSV is annoying, especially when you want to track insights recurrently.
Rows combines the best of both worlds: it lets you manipulate data with the familiarity of a spreadsheet, and adds on top data ingestion capabilities that get you covered when you need to track metrics over time.
What is Rows
Rows is a 100% spreadsheet editor that combines a modern UI, AI-powered capabilities, data integrations (with Social media, Analytics, databases, CRMs…), and a novel sharing experience that turns any spreadsheet into a website in one click.
If you haven't signed up for Rows, do that here and log in to your account. With Rows, you can fetch live data right from your Google Search Console account into your spreadsheet. This means that you don’t need to navigate complex 3rd party dashboards, and you can use familiar functions to perform the entire process we outlined above.
Plus, with our schedule feature your data is automatically updated. No more back and forth with files or copy/paste and more time for your analysis.
Using the Google Search Console Keywords Research template
Rows Google Search Console Keywords Research Template reproduces the same table you would get from GA4 but within the spreadsheet interface.
Let’s dive in! 🏊
Visit the page and click on Use Template. Select the folder you want to save. When you land on the spreadsheet, follow the link in the white dialog above to connect your Google Search Console account.
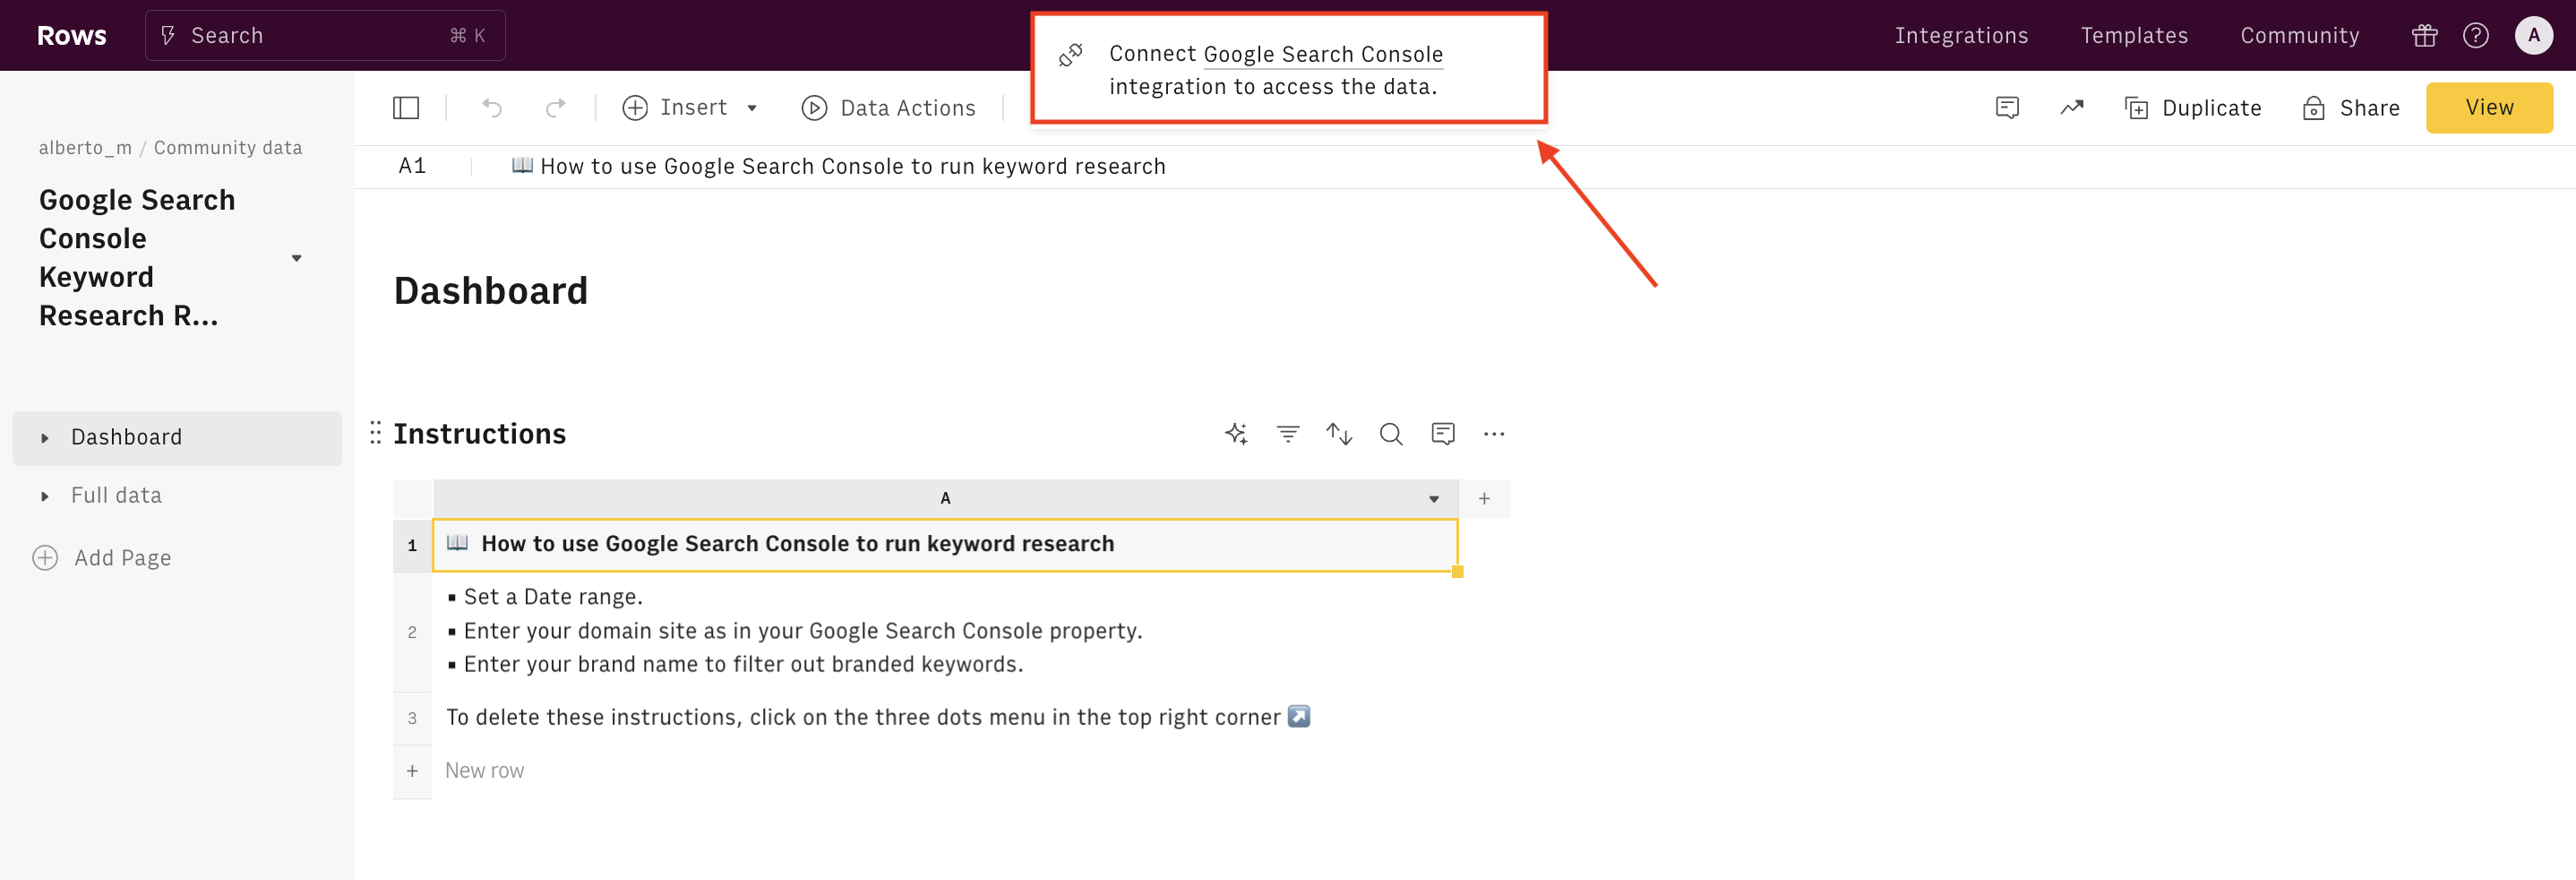
You will be redirected to the usual Google Auth flow to input your credentials and then back to Rows.
Use the tour below to have a quick demo tour of the template:
The first table contains a few lines of instructions. The Setup table includes a few fields to be used to set up the template:
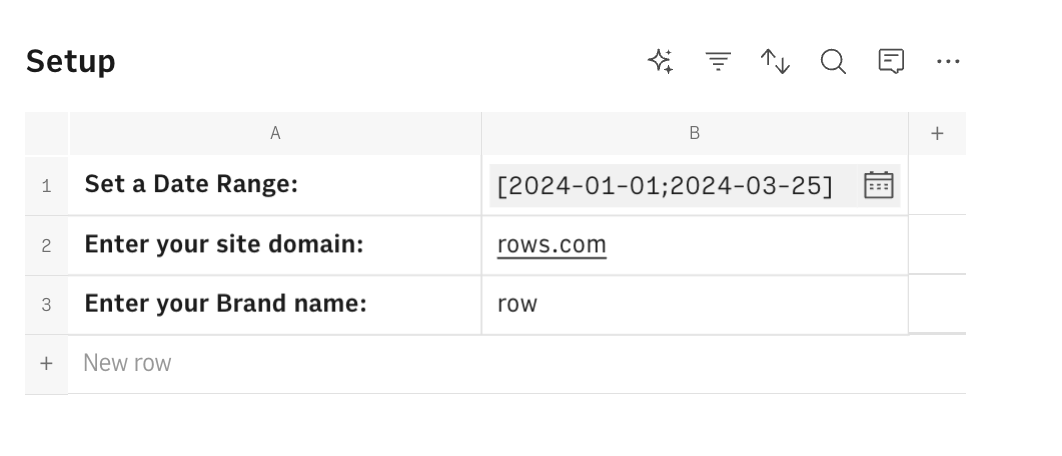
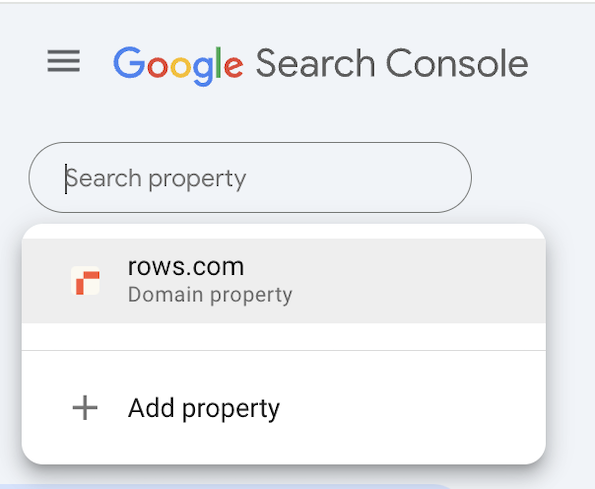
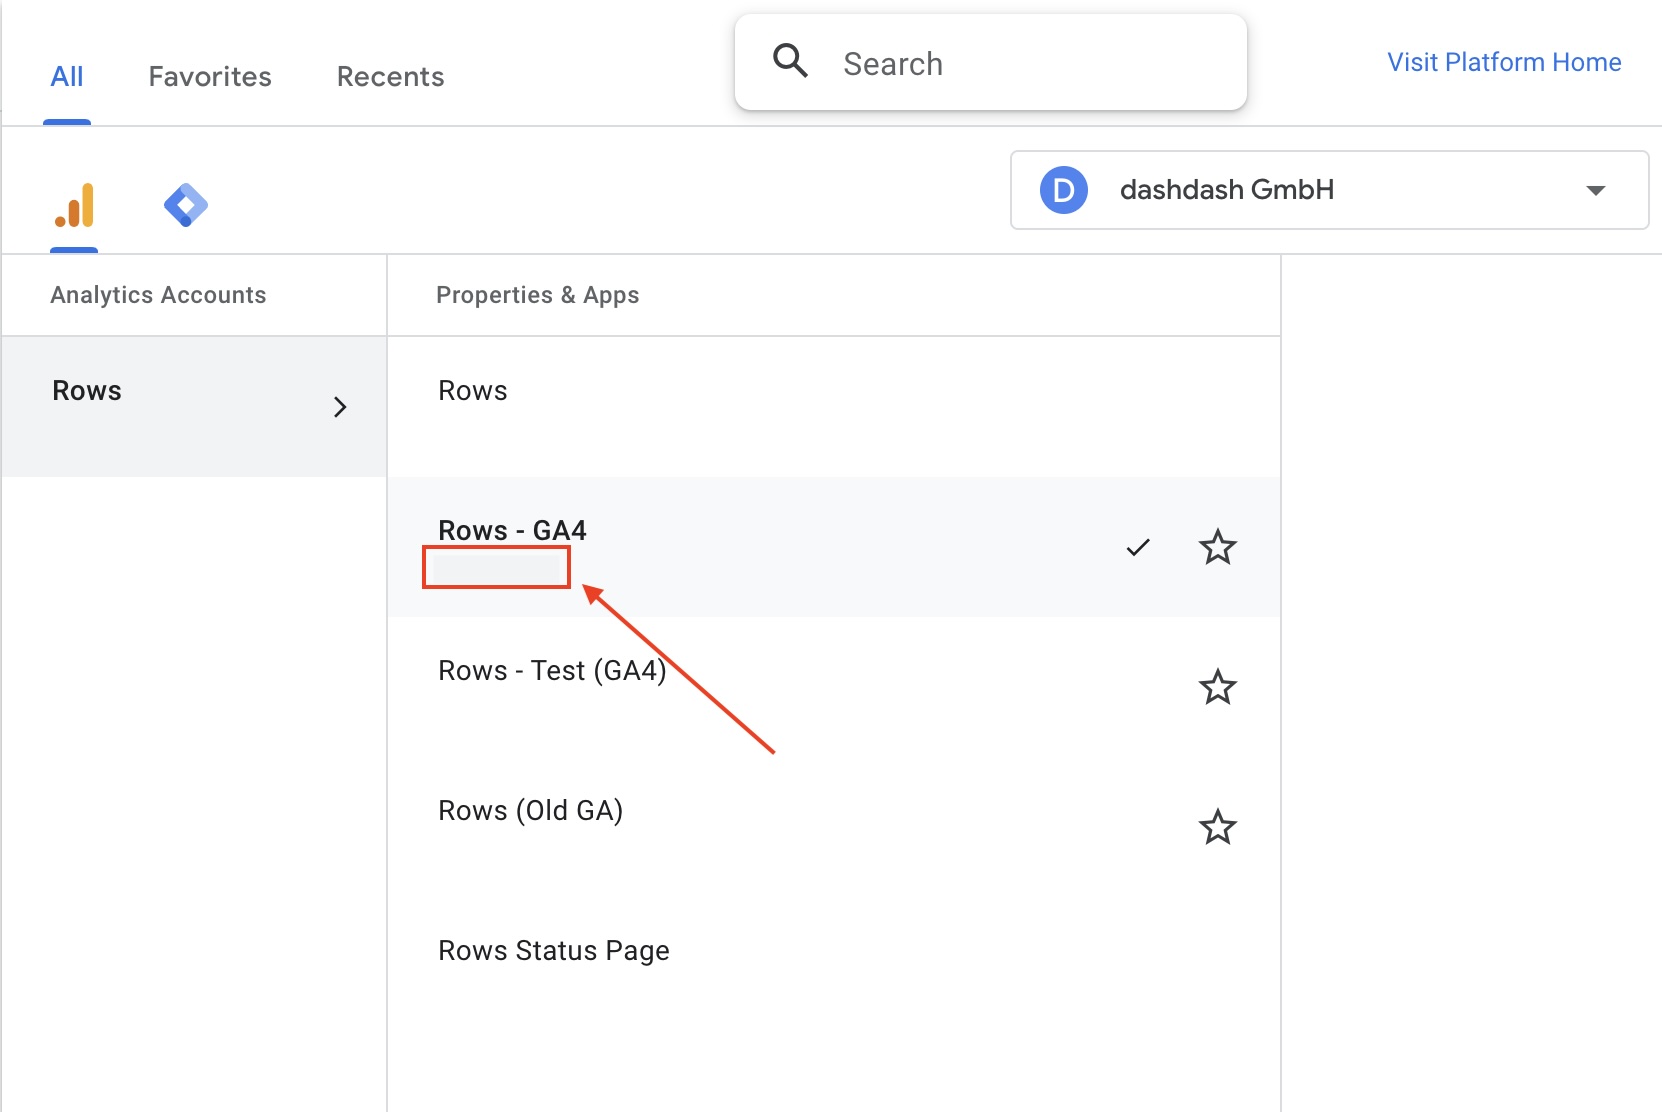
Input your Domain in cell B1: to find it, go to your GSC dashboard, and click on the Search Property in the top left corner. Your domain name will appear in the dropdown as follows:
Enter the date range you want to run the analysis in.
Enter your brand name: use cell B3 to add your brand name (e.g. 'Rows'). This field will be used in the next tables to filter out traffic from branded keywords, i.e. keywords that include your brand name and represent traffic from people who already know your brand.
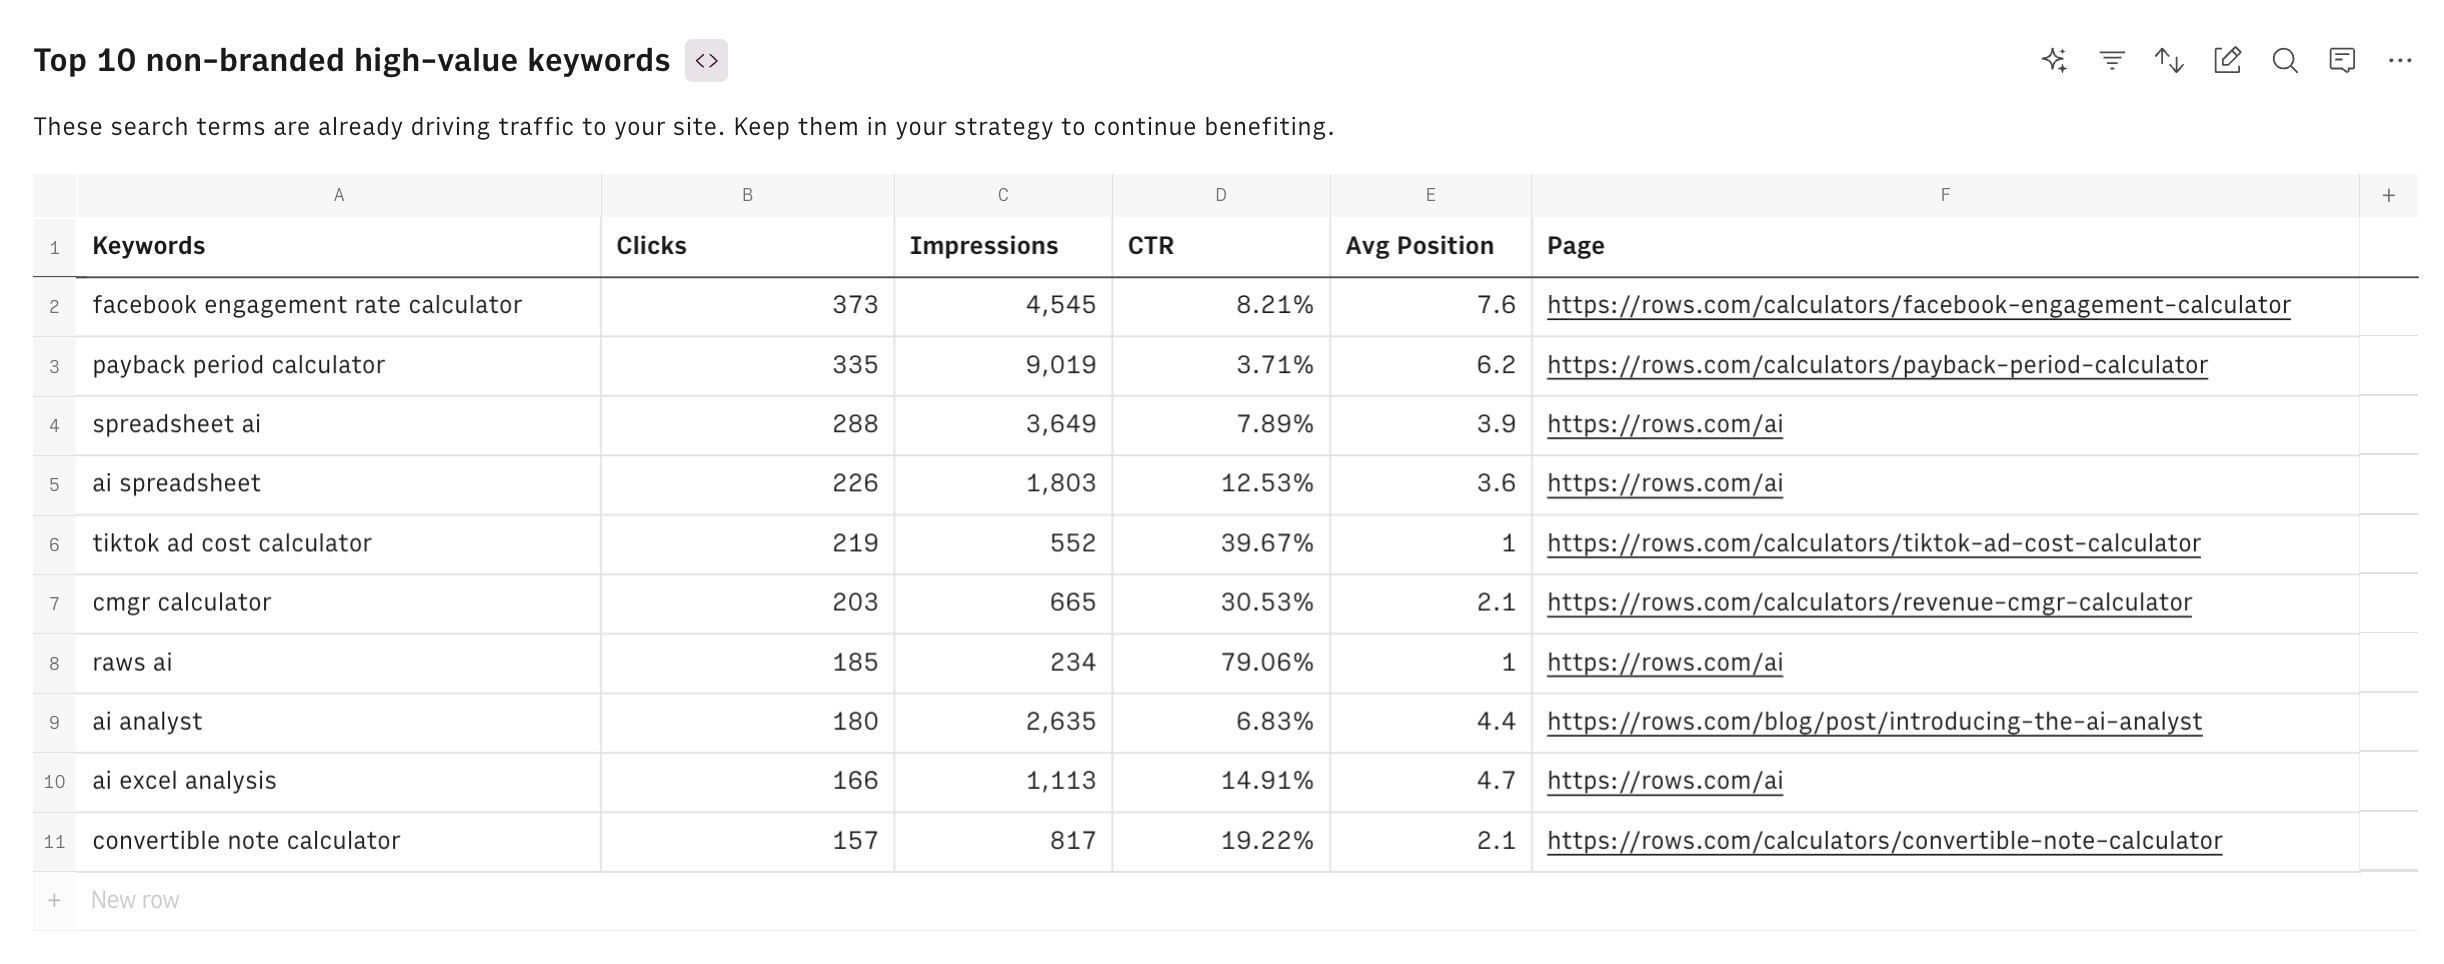
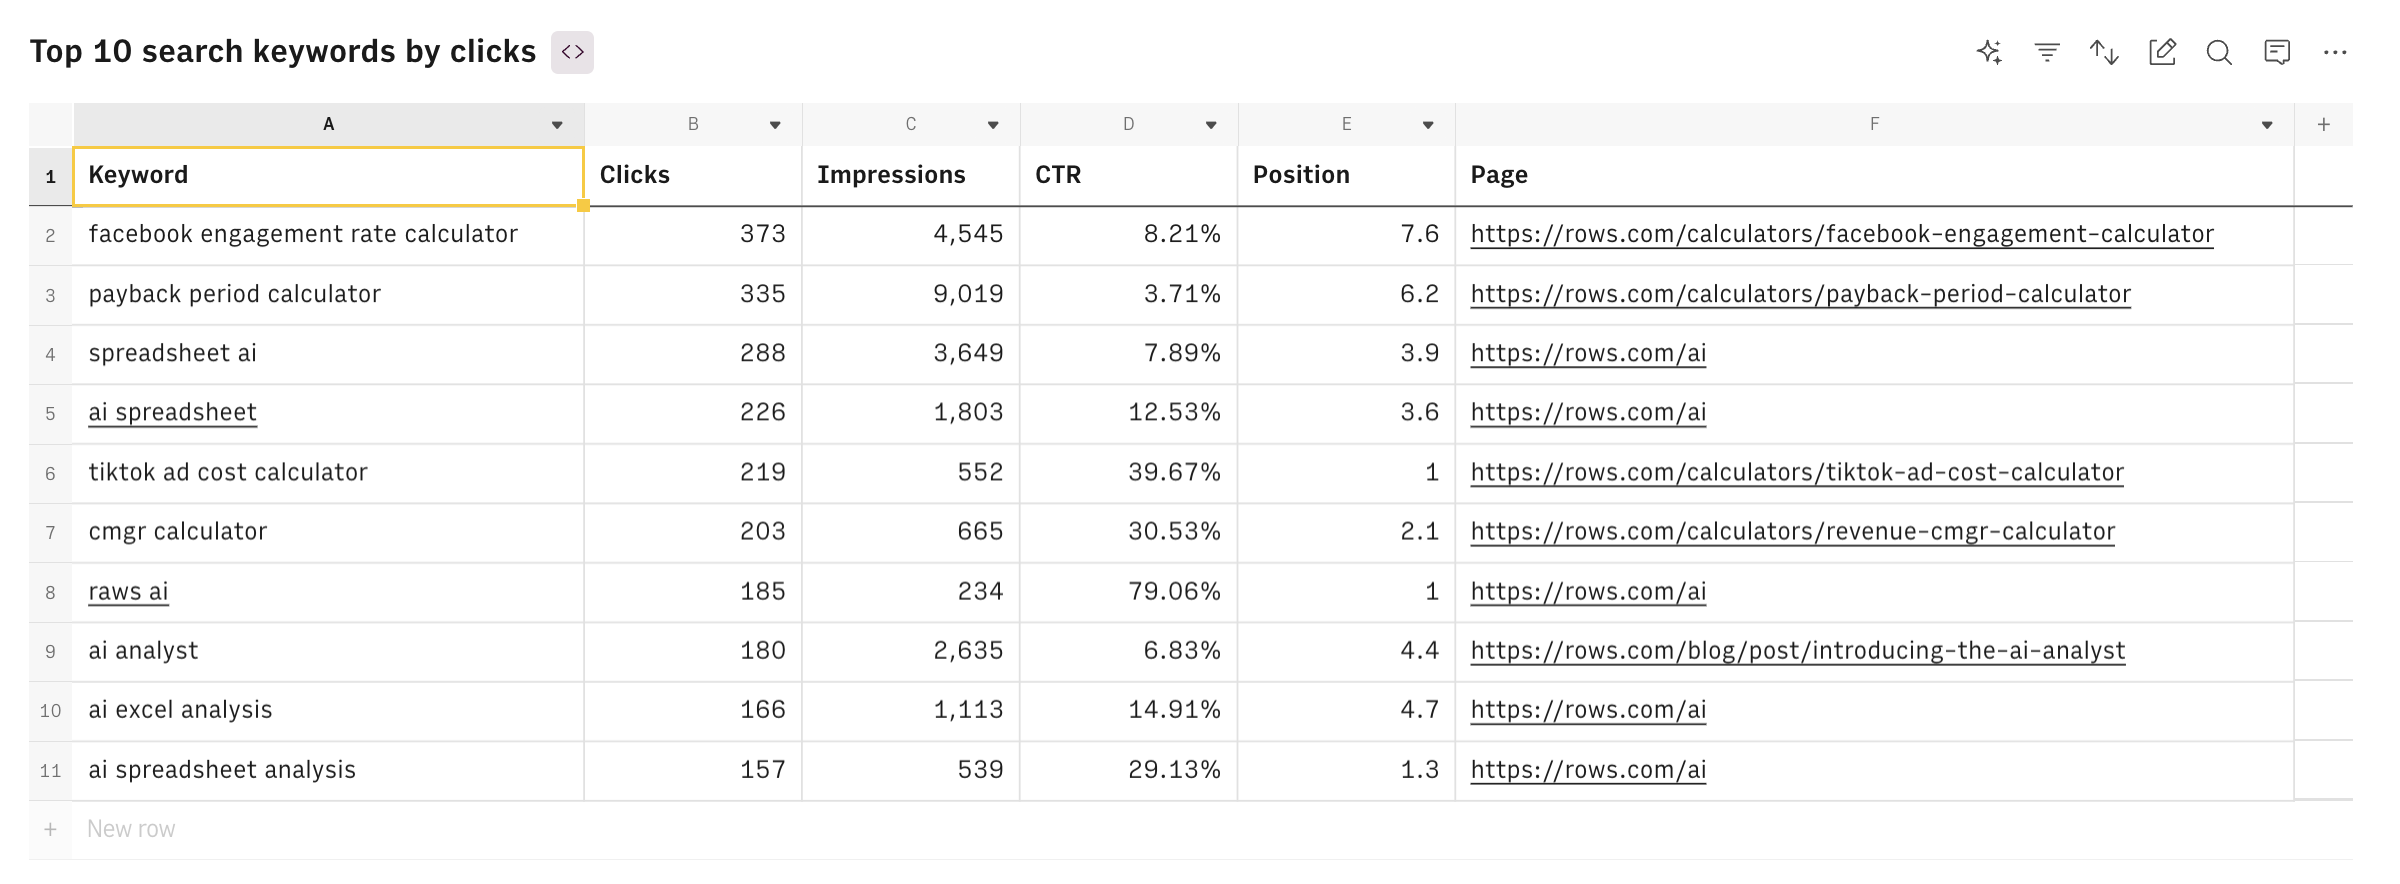
The first table displays the top 10 keywords by number of clicks: these are keywords that are driving meaningful traffic to your website.
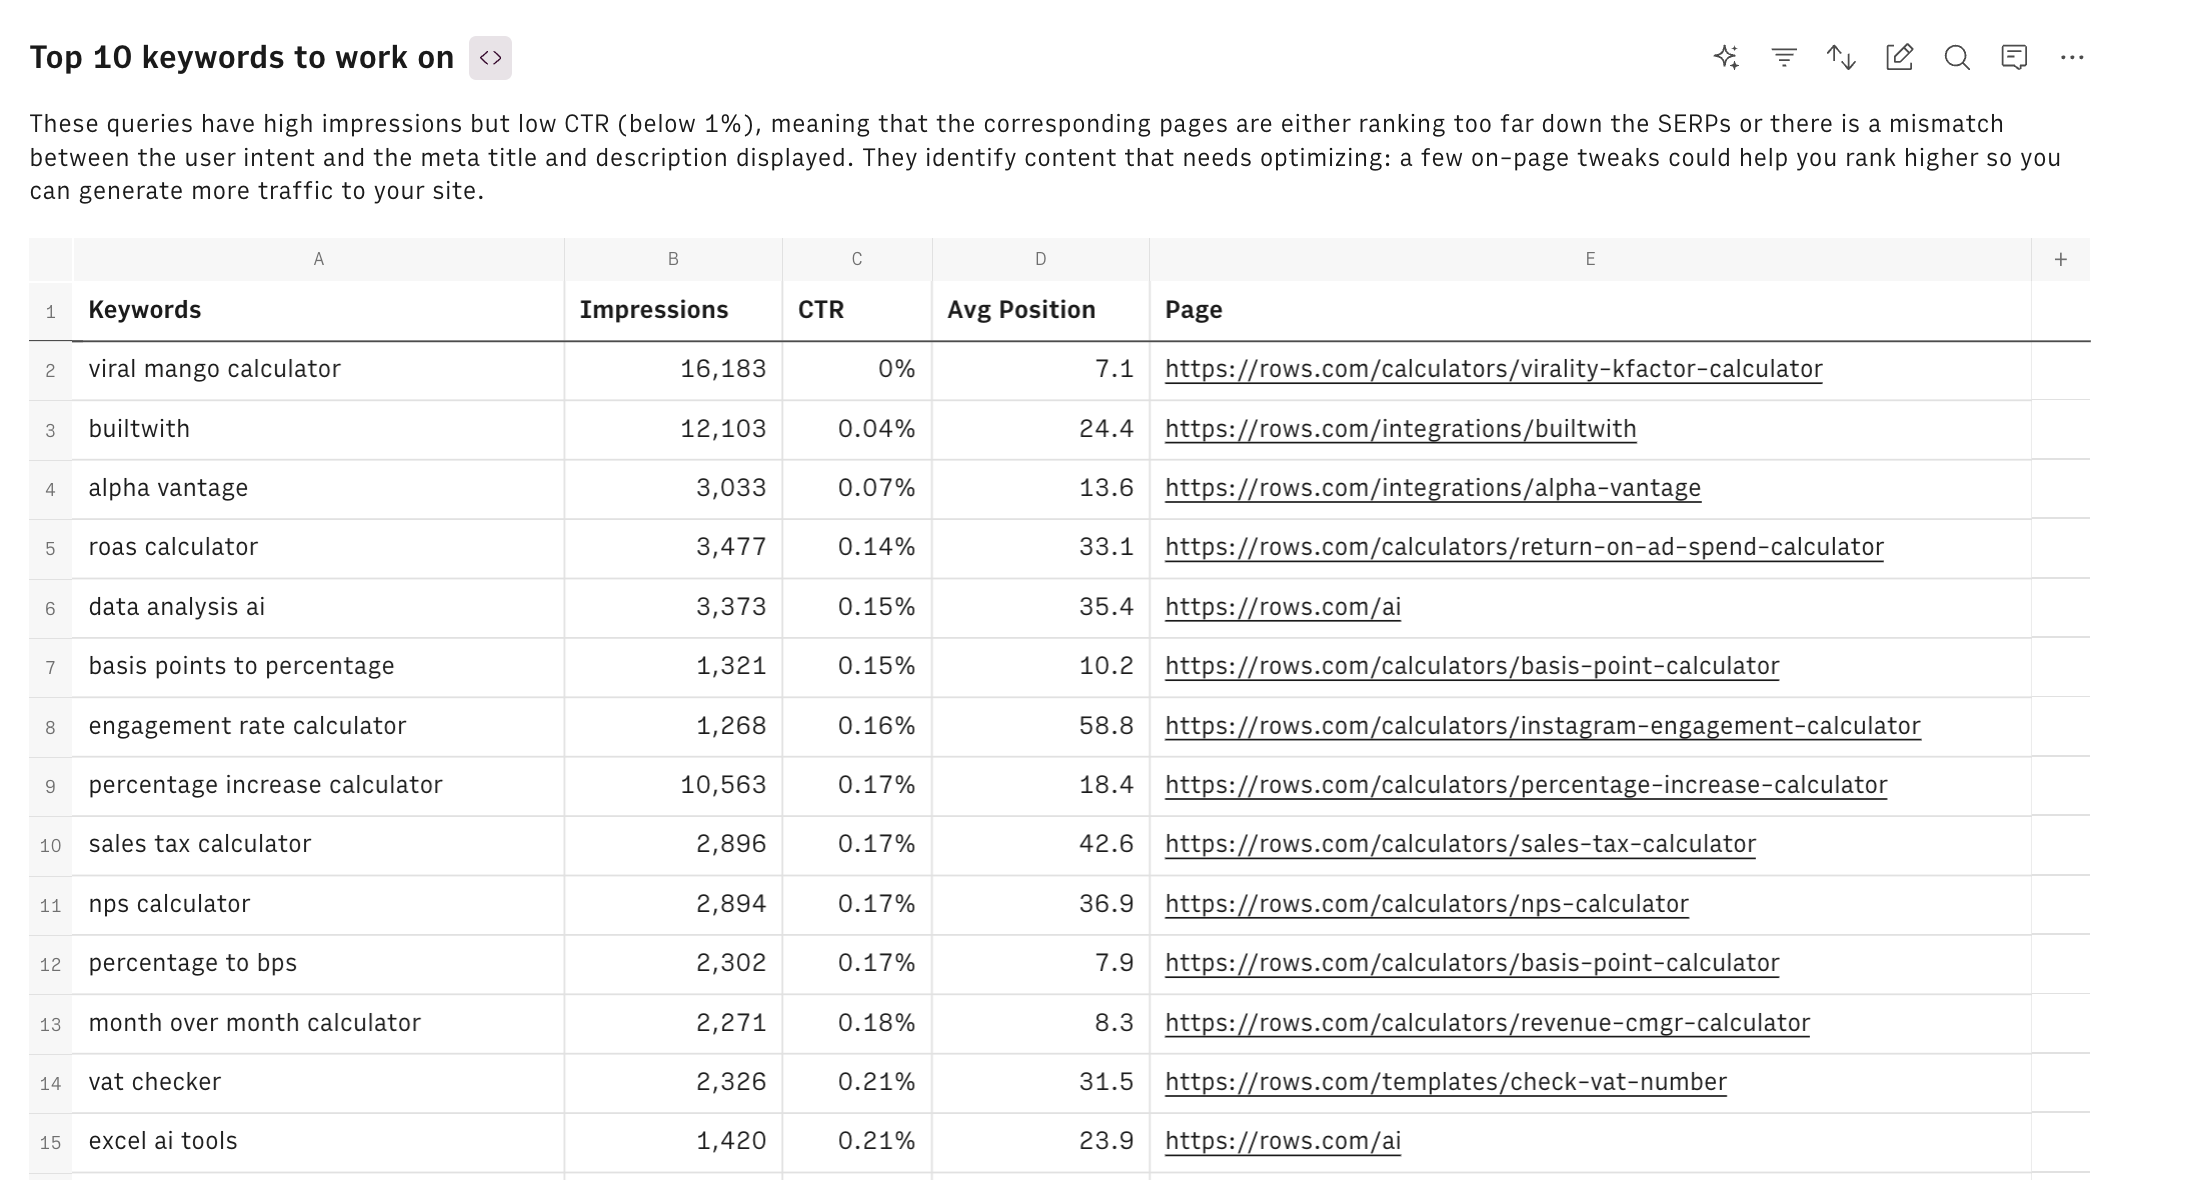
The second table shows the top keywords to work on: these queries have high impressions but low CTR (below 1%), meaning that the corresponding pages are either ranking too far down the SERPs or there is a mismatch between the user intent and the meta title and description displayed. They identify content that needs optimizing: a few on-page tweaks could help you rank higher so you can generate more traffic to your site.
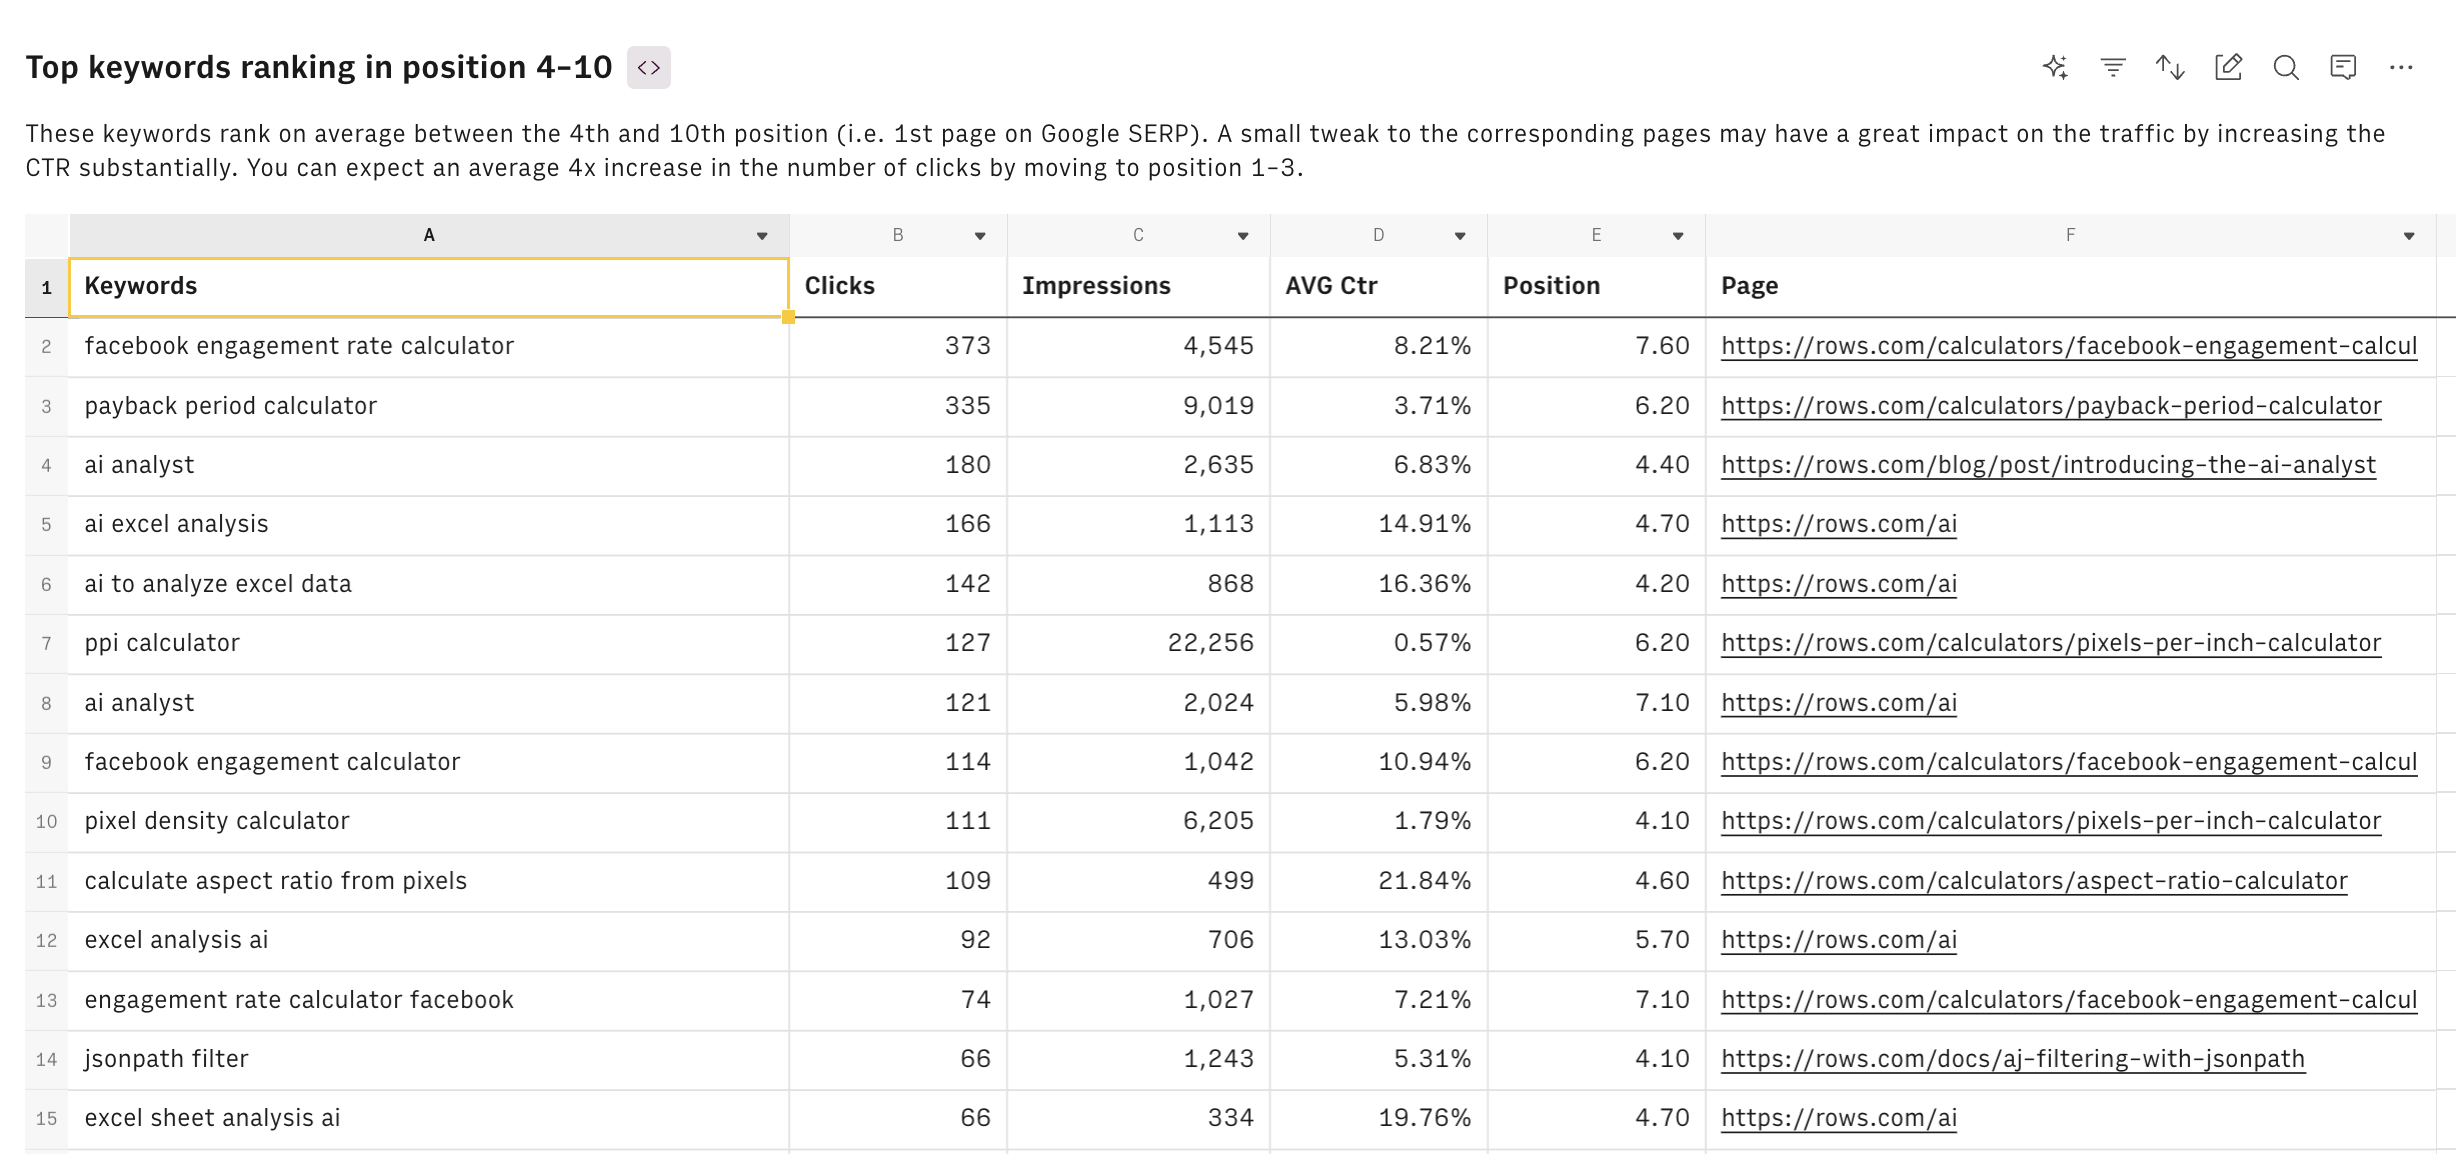
The last table includes the top keywords ranking in positions 4-10: these keywords rank on average between the 4th and 10th position (i.e. 1st page on Google SERP). A small tweak to the corresponding pages may have a great impact on the traffic by increasing the CTR substantially. You can expect an average 4x increase in the number of clicks by moving to positions 1-3. SEO experts usually refer to these keywords as 'easy wins' or 'low-hanging fruits'.
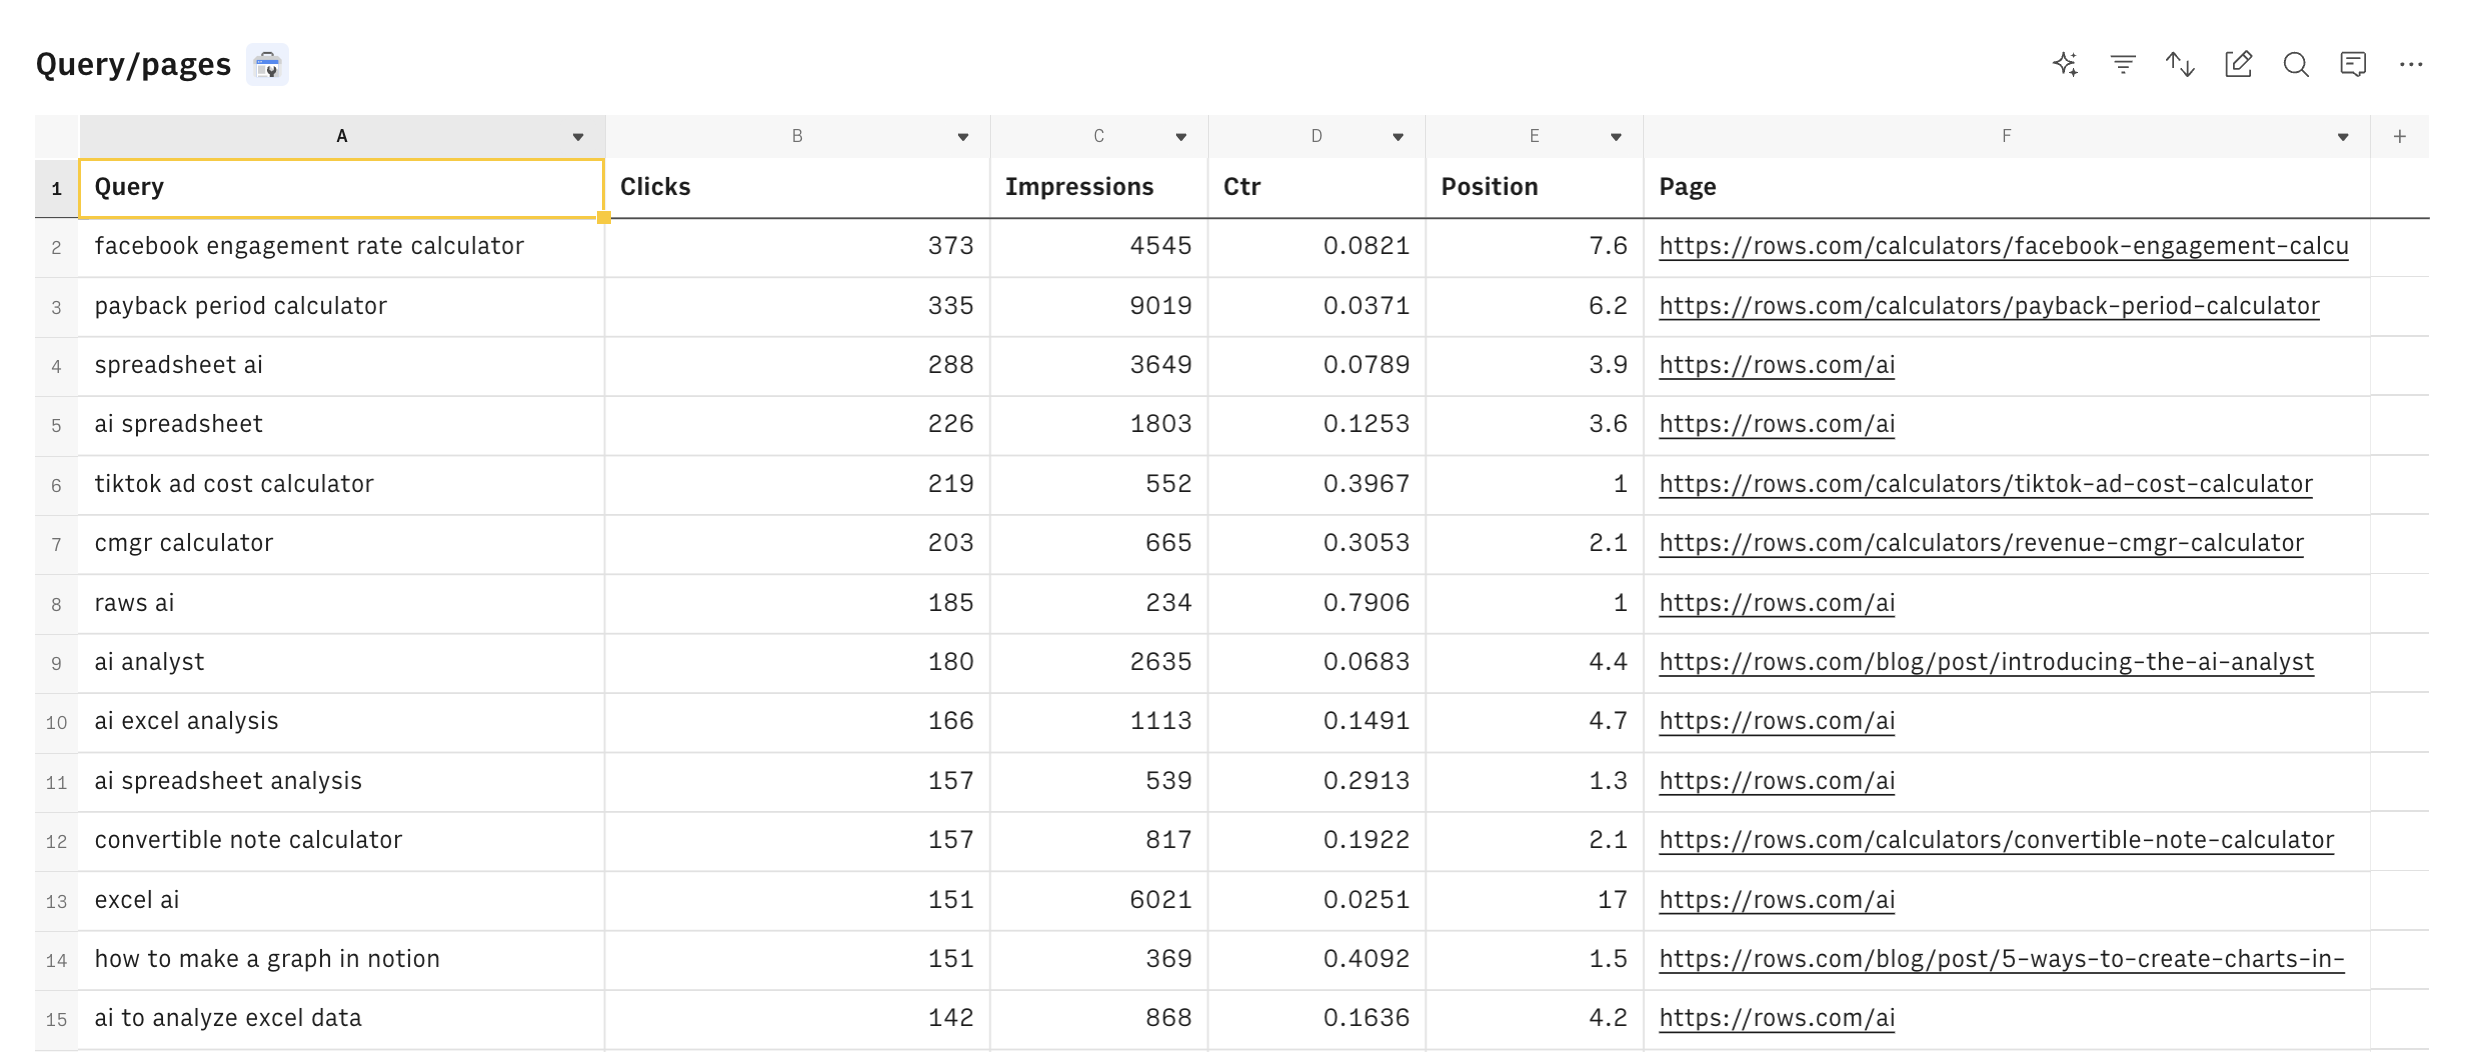
Finally, the table in the Full Data page contains the KPIs of all combination Page / Query:
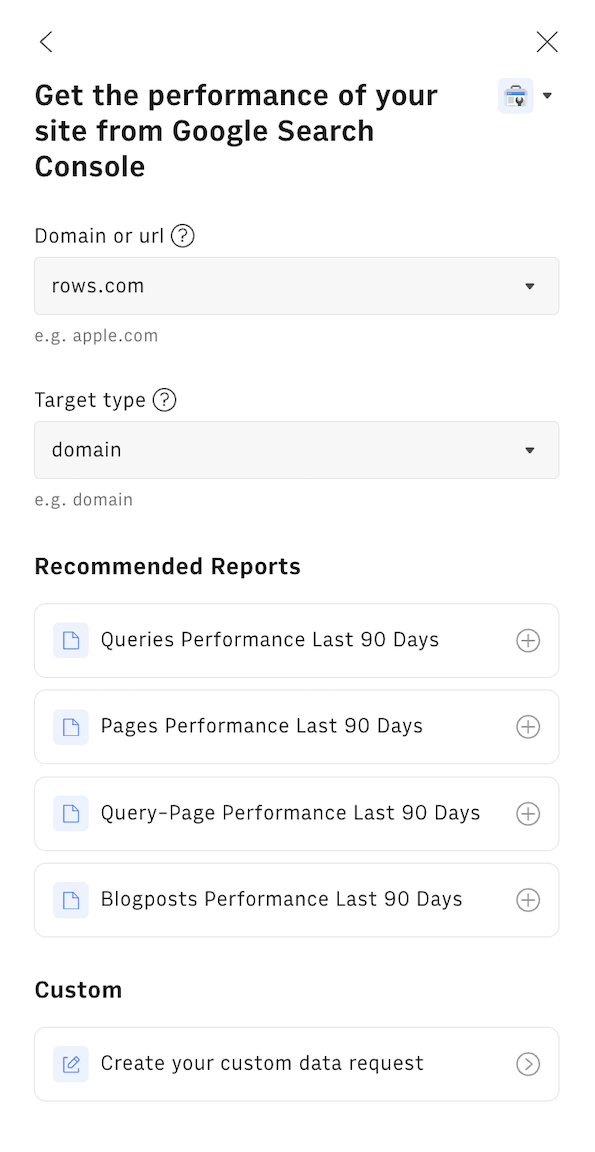
To create a new view with GSC data, all you need to do is select Google Search Console under the Data Actions menu:
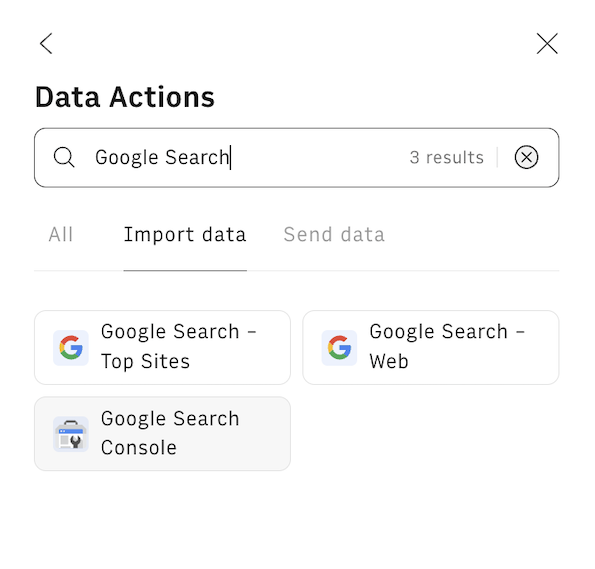
Here you can pick one of the recommended reports or build one fully custom:
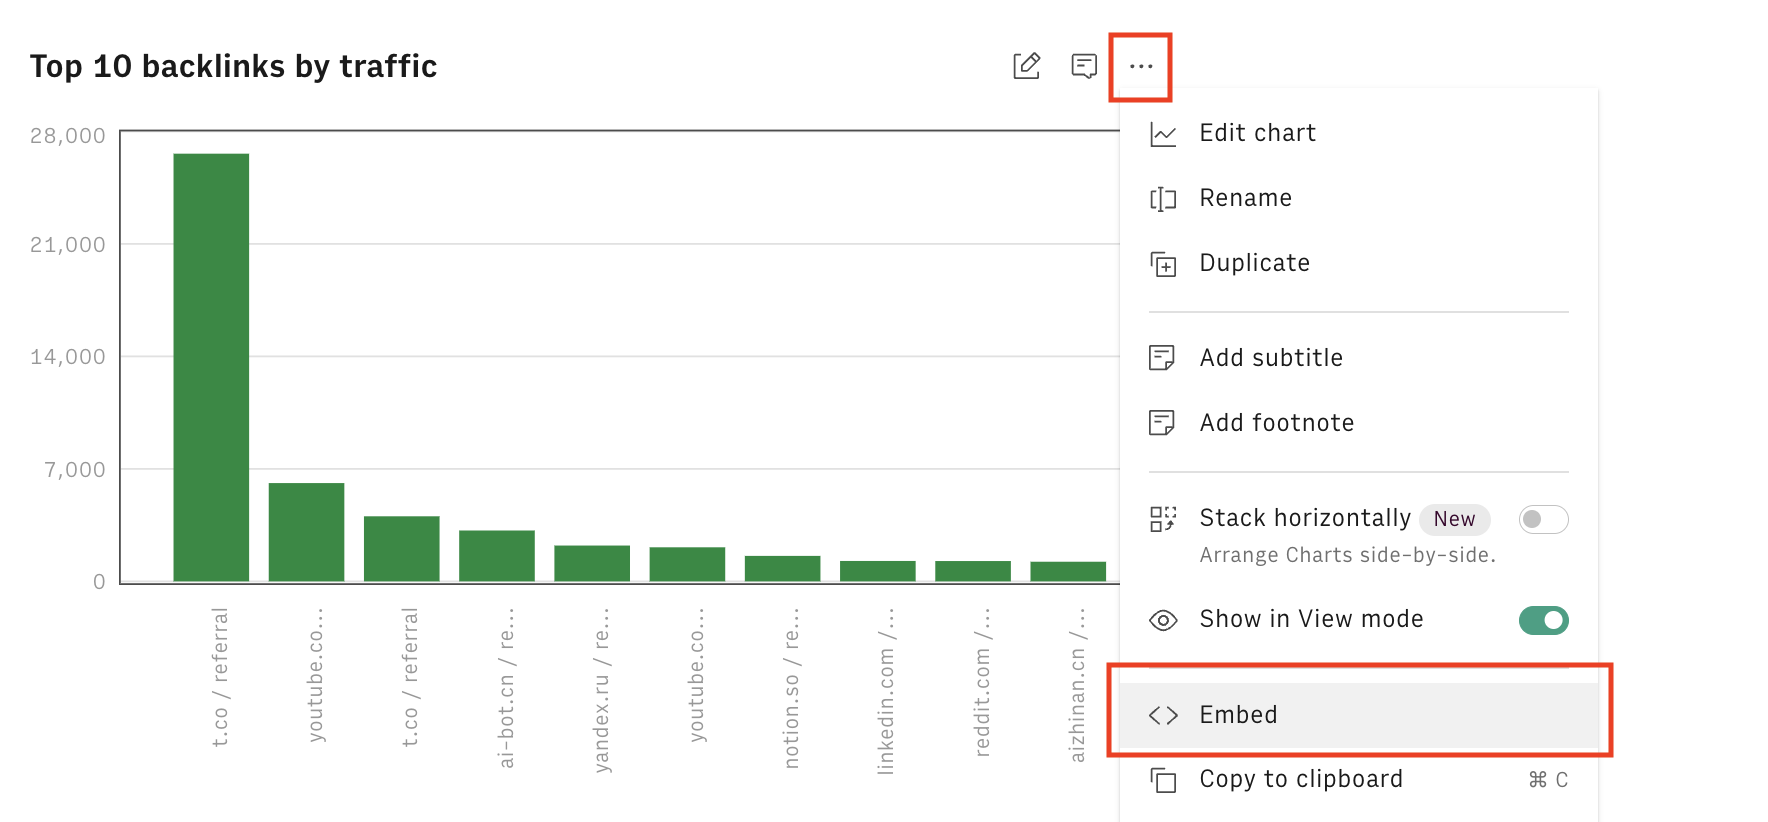
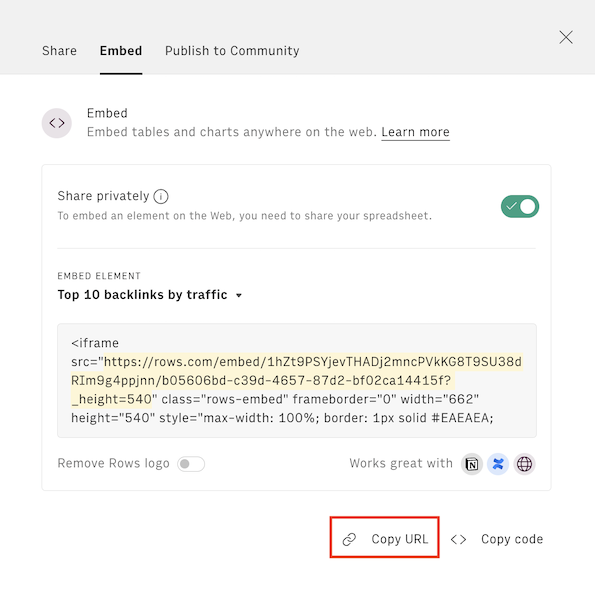
You can finally customize your template by adding new charts, or Embed elements into your Notion or Confluence reports. To do so, click on any chart’s or table’s options menu (…) and select Embed:
A modal will popup asking you to enable private sharing:
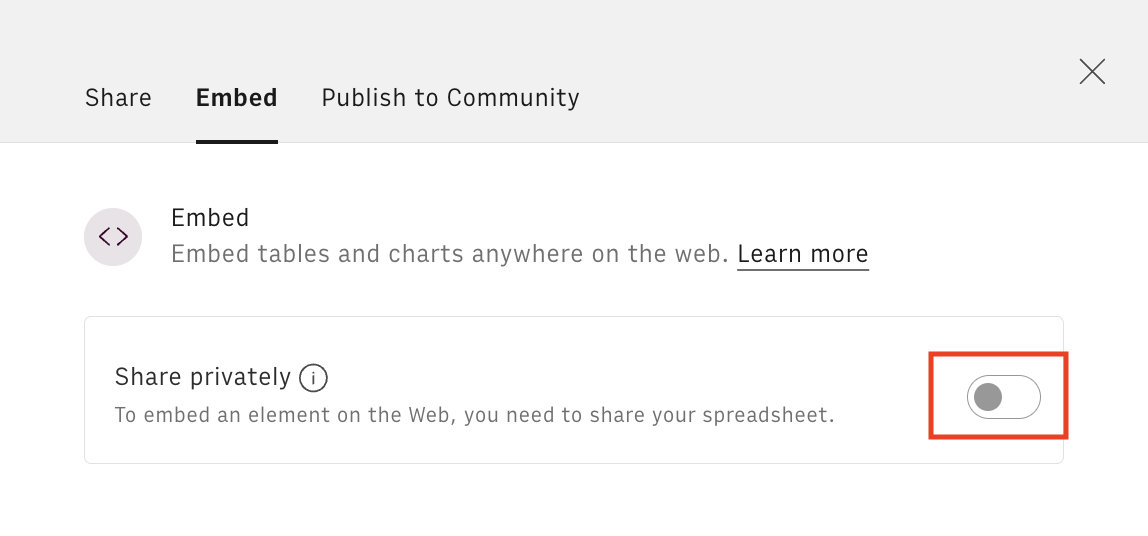
Then click on Copy URL and paste it on Notion or Confluence to add dynamic data to your document:
Using the GA4 SEO Keywords template
Looking for a simpler solution to check your keywords' performance? Have a look at our GA4 SEO Keywords report, which combines also the performance of internal queries using GA4 data.
The template combines data from Google Analytics 4 and Google Search Console and offers a simpler, straight-to-the-point view of your overall and page-specific keyword performance.
Start by connecting both Google Analytics 4 and Google Search Console integrations, following the white dialog at the top of the template once you open it. Alternatively, you can click on Connect on the following respective pages: Google Analytics 4 and Google Search Console.
Use the Setup table to input the following data:
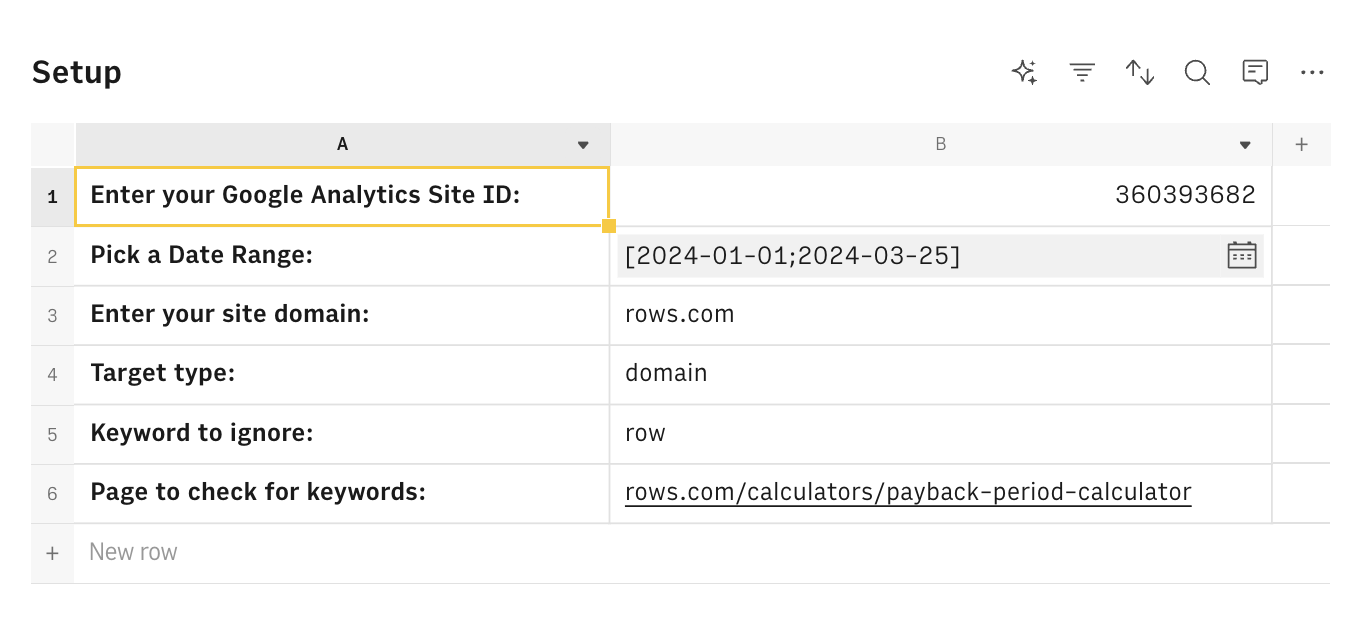
Your GA4 Property ID, as it appears in your GA4 dashboard
A date range to run the analysis
Your Site Domain, as displayed in your GSC dashboard
Keywords to ignore (e.g. branded keywords)
A specific URL you want to analyze
The first table outlines the performance of your best keywords ordered by number of clicks.
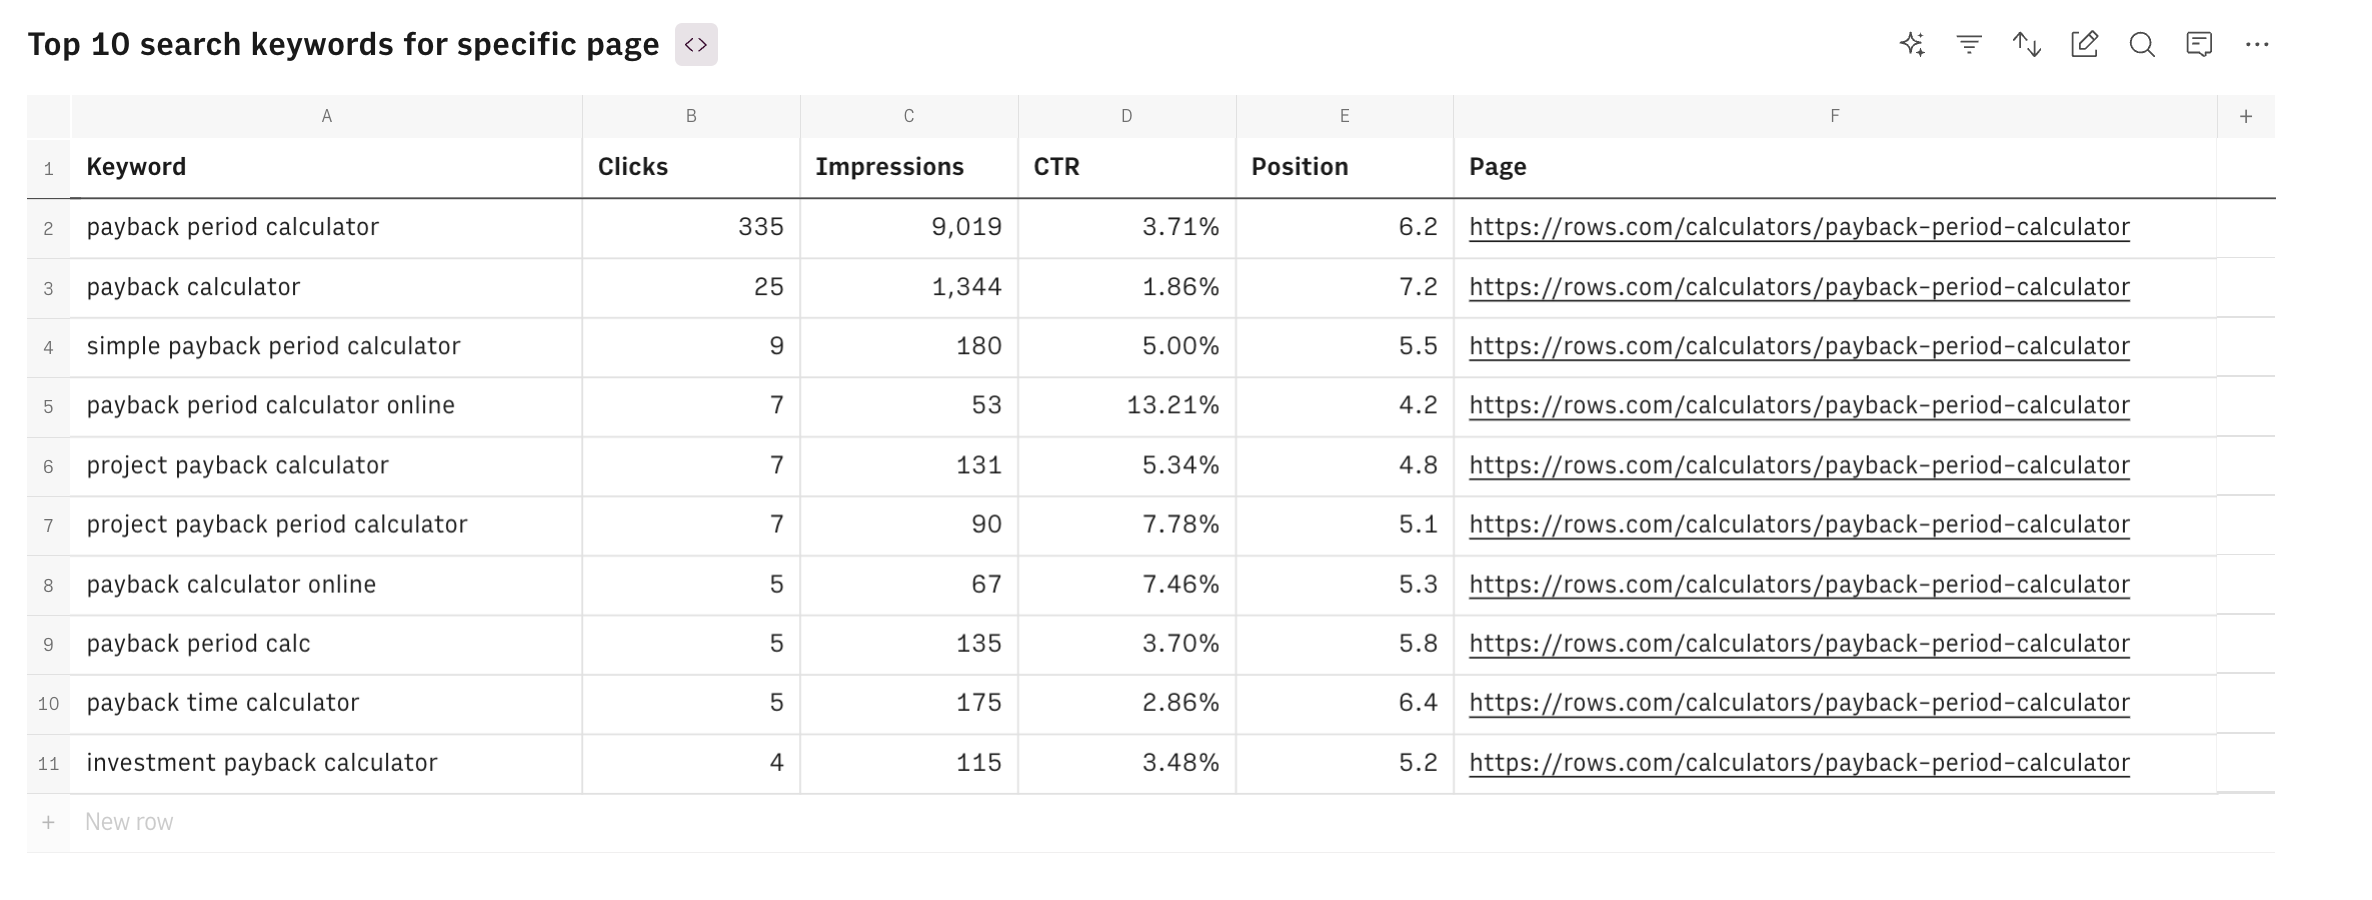
The second table showcases the performance of the top keyword for the specific page you inputted above
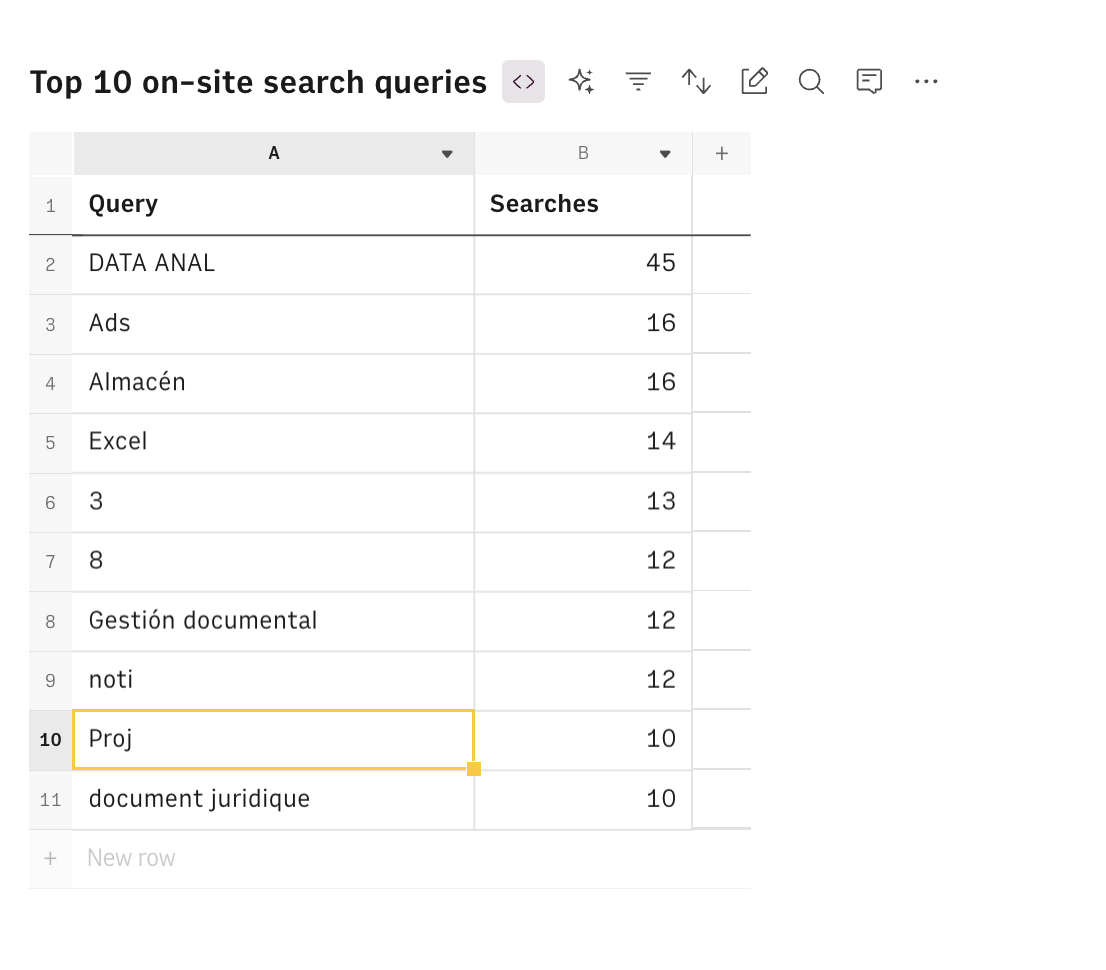
The third uses data from GA4 to list the most popular on-site searches: these refer to the specific terms or phrases that users enter into the search function on your website. This data is crucial because it provides insights into what visitors are looking for directly after arriving at your site
Visit the Full data page to have a look to the complete data from GSC and GA4. Use the (...) option menu to customize the tables by selecting additional metrics or changing dimensions.
Get the most out of keyword research with Rows
In this article, we reviewed two methods to do keyword research for your website using data from Google Search Console.
The first one uses the default Search Console interface. The second employs Rows to bypass Google’s layout, import data, and manipulate it directly on the spreadsheet and surface key insights.
Rows combine the flexibility (and familiarity) of a spreadsheet with the data ingestion capabilities of modern analytics tools, enabling users to pull data from Google Search Console, manipulate it at ease, and share it beautifully on modern wikis and websites via Embed.
Try it now without an account at rows.com and set everything up in seconds with our Google Search Console Keyword Research template.
Interested in other tasks using Google Search Console? Discover our best Google Search Console templates.
Discover what else you can do by pairing Rows and Google Analytics in our Top 7 Google Analytics Dashboards.